

A longitudinal study of atrophy in amnestic mild cognitive impairment and normal aging revealed by cortical thickness
- PMID: 23133666
- PMCID: PMC3487850
- DOI: 10.1371/journal.pone.0048973
A longitudinal study of atrophy in amnestic mild cognitive impairment and normal aging revealed by cortical thickness
Abstract
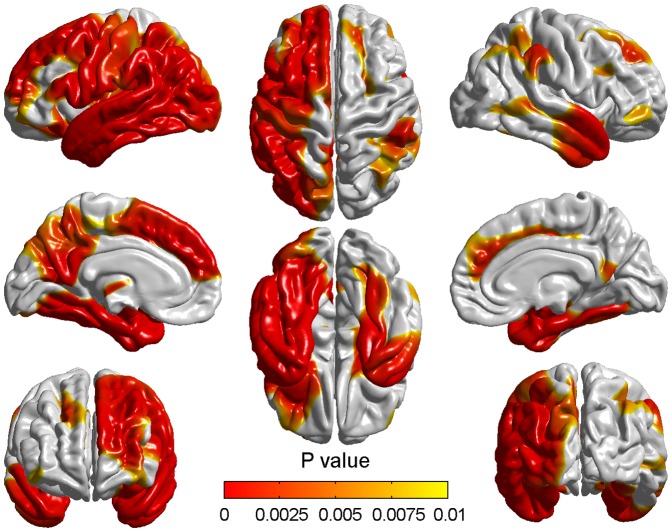
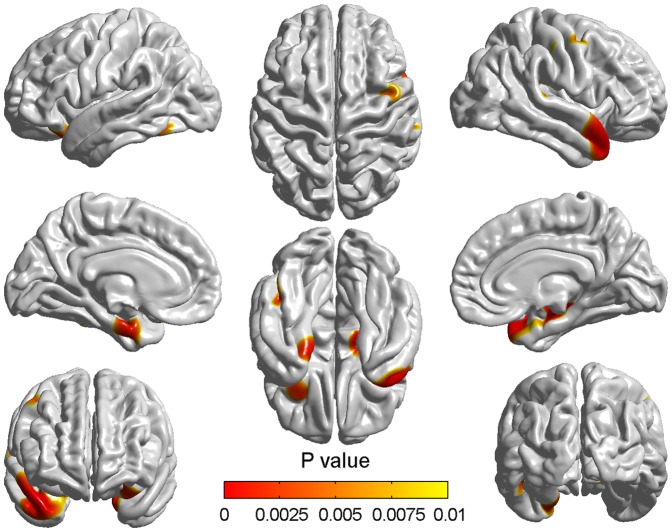
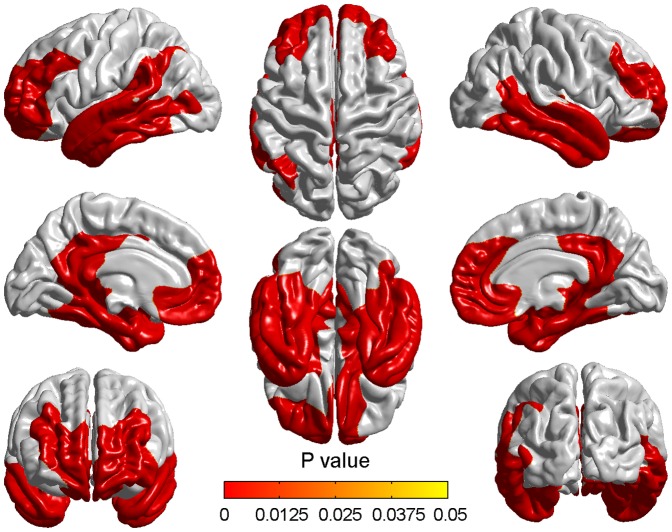
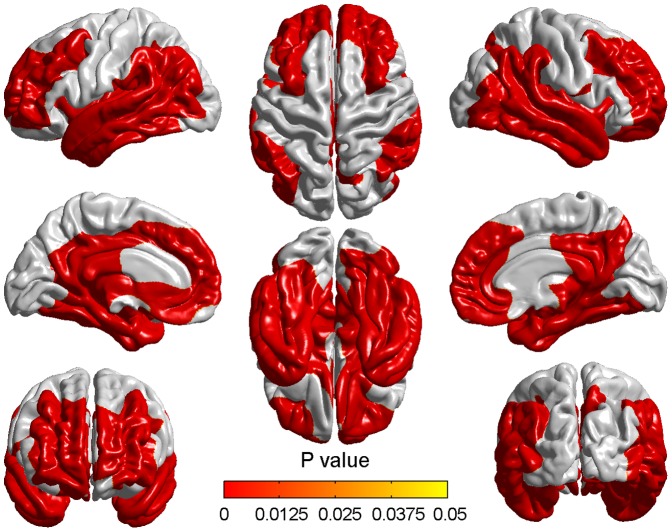
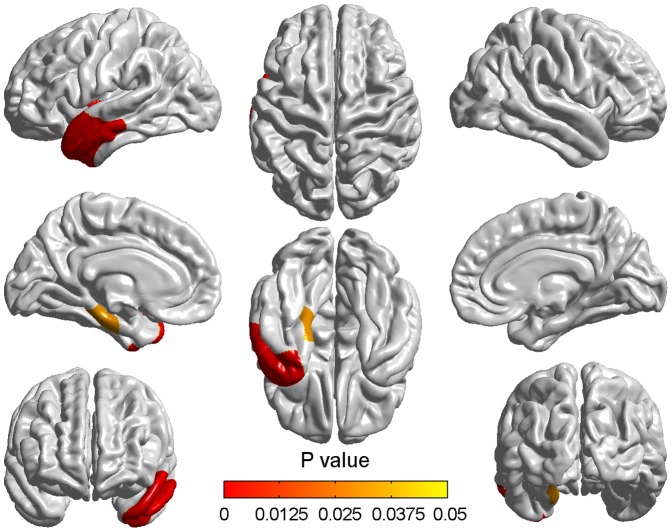
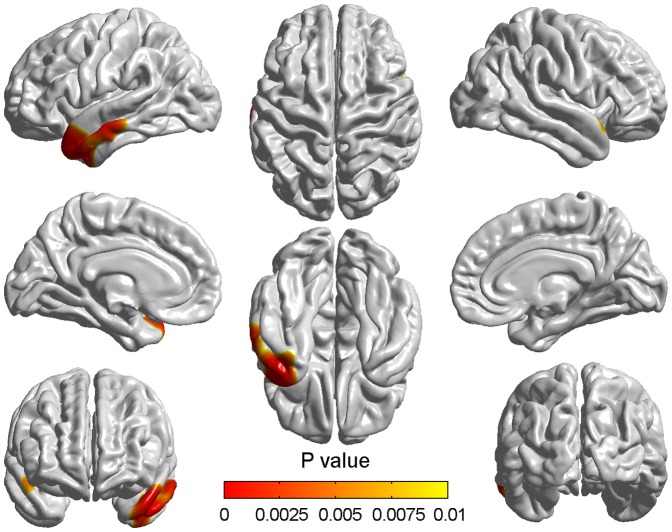
In recent years, amnestic mild cognitive impairment (aMCI) has attracted significant attention as an indicator of high risk for Alzheimer's disease. An understanding of the pathology of aMCI may benefit the development of effective clinical treatments for dementia. In this work, we measured the cortical thickness of 109 aMCI subjects and 99 normal controls (NC) twice over two years. The longitudinal changes and the cross-sectional differences between the two types of participants were explored using the vertex thickness values. The thickness of the cortex in aMCI was found significantly reduced in both longitudinal and between-group comparisons, mainly in the temporal lobe, superolateral parietal lobe and some regions of the frontal cortices. Compared to NC, the aMCI showed a significantly high atrophy rate in the left lateral temporal lobe and left parahippocampal gyrus over two years. Additionally, a significant positive correlation between brain atrophy and the decline of Mini-Mental State Examination (MMSE) scores was also found in the left superior and left middle temporal gyrus in aMCI. These findings demonstrated specific longitudinal spatial patterns of cortical atrophy in aMCI and NC. The higher atrophy rate in aMCI might be responsible for the accelerated functional decline in the aMCI progression process.
Conflict of interest statement
Figures
Similar articles
-
Precuneus Structure Changes in Amnestic Mild Cognitive Impairment.Am J Alzheimers Dis Other Demen. 2017 Feb;32(1):22-26. doi: 10.1177/1533317516678087. Epub 2016 Nov 15. Am J Alzheimers Dis Other Demen. 2017. PMID: 28100076 Free PMC article.
-
Correlation Between Brain Structure Atrophy and Plasma Amyloid-β and Phosphorylated Tau in Patients With Alzheimer's Disease and Amnestic Mild Cognitive Impairment Explored by Surface-Based Morphometry.Front Aging Neurosci. 2022 Apr 25;14:816043. doi: 10.3389/fnagi.2022.816043. eCollection 2022. Front Aging Neurosci. 2022. PMID: 35547625 Free PMC article.
-
Exploring cortical morphology biomarkers of amnesic mild cognitive impairment using novel fractal dimension-based structural MRI analysis.Eur J Neurosci. 2024 Nov;60(9):6254-6266. doi: 10.1111/ejn.16557. Epub 2024 Oct 1. Eur J Neurosci. 2024. PMID: 39353858
-
Mapping the patterns of cortical thickness in single- and multiple-domain amnestic mild cognitive impairment patients: a pilot study.Aging (Albany NY). 2019 Nov 22;11(22):10000-10015. doi: 10.18632/aging.102362. Epub 2019 Nov 22. Aging (Albany NY). 2019. PMID: 31756169 Free PMC article.
-
Structural magnetic resonance imaging for the early diagnosis of dementia due to Alzheimer's disease in people with mild cognitive impairment.Cochrane Database Syst Rev. 2020 Mar 2;3(3):CD009628. doi: 10.1002/14651858.CD009628.pub2. Cochrane Database Syst Rev. 2020. PMID: 32119112 Free PMC article.
Cited by
-
The neurophysiology and seizure outcomes of late onset unexplained epilepsy.Clin Neurophysiol. 2020 Nov;131(11):2667-2672. doi: 10.1016/j.clinph.2020.08.014. Epub 2020 Sep 19. Clin Neurophysiol. 2020. PMID: 32957039 Free PMC article.
-
Characterization of the angular gyrus in an older adult population: a multimodal multilevel approach.Brain Struct Funct. 2023 Jan;228(1):83-102. doi: 10.1007/s00429-022-02529-3. Epub 2022 Jul 29. Brain Struct Funct. 2023. PMID: 35904594 Free PMC article.
-
CT-Detected MTA Score Related to Disability and Behavior in Older People with Cognitive Impairment.Biomedicines. 2022 Jun 10;10(6):1381. doi: 10.3390/biomedicines10061381. Biomedicines. 2022. PMID: 35740403 Free PMC article.
-
Prediction of clinical and biomarker conformed Alzheimer's disease and mild cognitive impairment from multi-feature brain structural MRI using age-correction from a large independent lifespan sample.Neuroimage Clin. 2020;28:102387. doi: 10.1016/j.nicl.2020.102387. Epub 2020 Aug 19. Neuroimage Clin. 2020. PMID: 32871388 Free PMC article.
-
Alterations in Gray Matter Structural Networks in Amnestic Mild Cognitive Impairment: A Source-Based Morphometry Study.J Alzheimers Dis. 2024;101(1):61-73. doi: 10.3233/JAD-231196. J Alzheimers Dis. 2024. PMID: 39093069 Free PMC article.
References
-
- Lyketsos CG, Lopez O, Jones B, Fitzpatrick AL, Breitner J, et al. (2002) Prevalence of Neuropsychiatric Symptoms in Dementia and Mild Cognitive Impairment: Results From the Cardiovascular Health Study. Jama-J Am Med Assoc 288: 1475–1483. - PubMed
-
- Rockwood K, Cosway S, Carver D, Jarrett P, Stadnyk K, et al. (1999) The risk of dementia and death after delirium. Age Ageing 28: 551–556. - PubMed
-
- Julkunen V, Niskanen E, Muehlboeck S, Pihlajamäki M, Könönen M, et al. (2009) Cortical Thickness Analysis to Detect Progressive Mild Cognitive Impairment: A Reference to Alzheimer's Disease. Dement Geriatr Cogn 28: 404–412. - PubMed
-
- Petersen RC, Smith GE, Waring SC, Ivnik RJ, Tangalos EG, et al. (1999) Mild cognitive impairment: clinical characterization and outcome. Arch Neurol 56: 303–308. - PubMed
-
- Petersen RC (2004) Mild cognitive impairment as a diagnostic entity. J? Intern Med 256: 183–194. - PubMed
Publication types
MeSH terms
Grants and funding
LinkOut - more resources
Full Text Sources
Medical
