. 2012;7(11):e49149.
doi: 10.1371/journal.pone.0049149. Epub 2012 Nov 2.

The single T65S mutation generates brighter cyan fluorescent proteins with increased photostability and pH insensitivity

Affiliations

The single T65S mutation generates brighter cyan fluorescent proteins with increased photostability and pH insensitivity

Asma Fredj et al. PLoS One. 2012.

Abstract

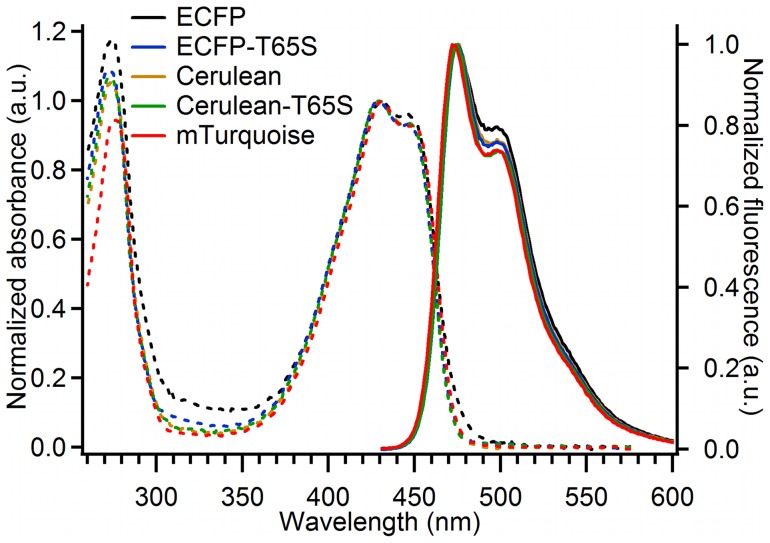
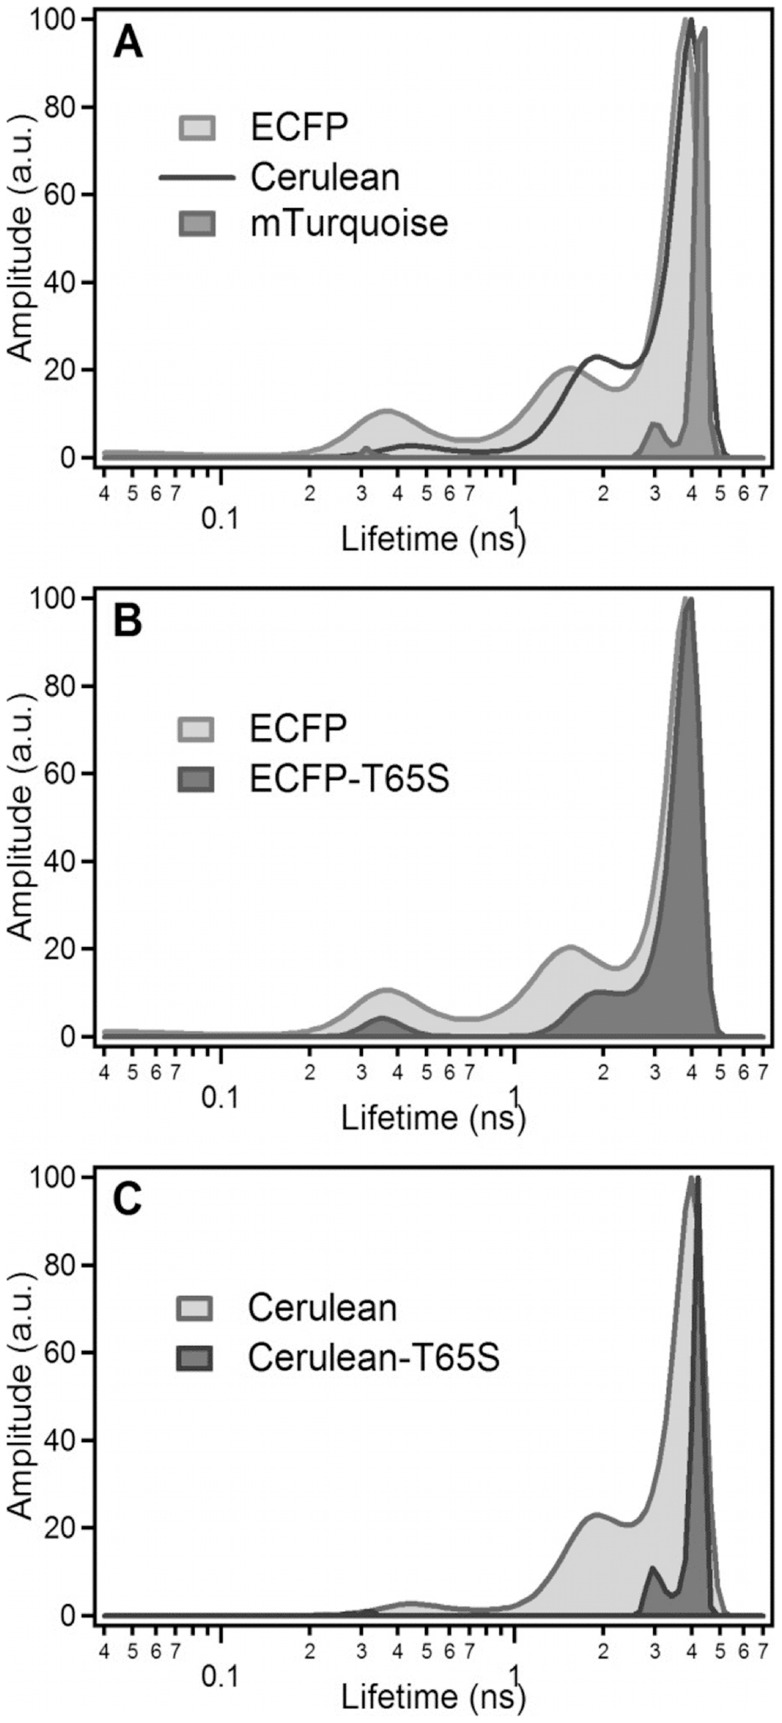
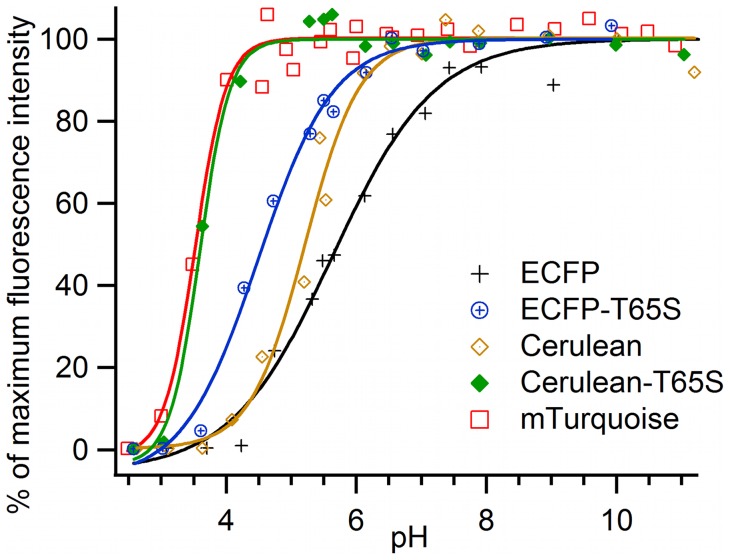
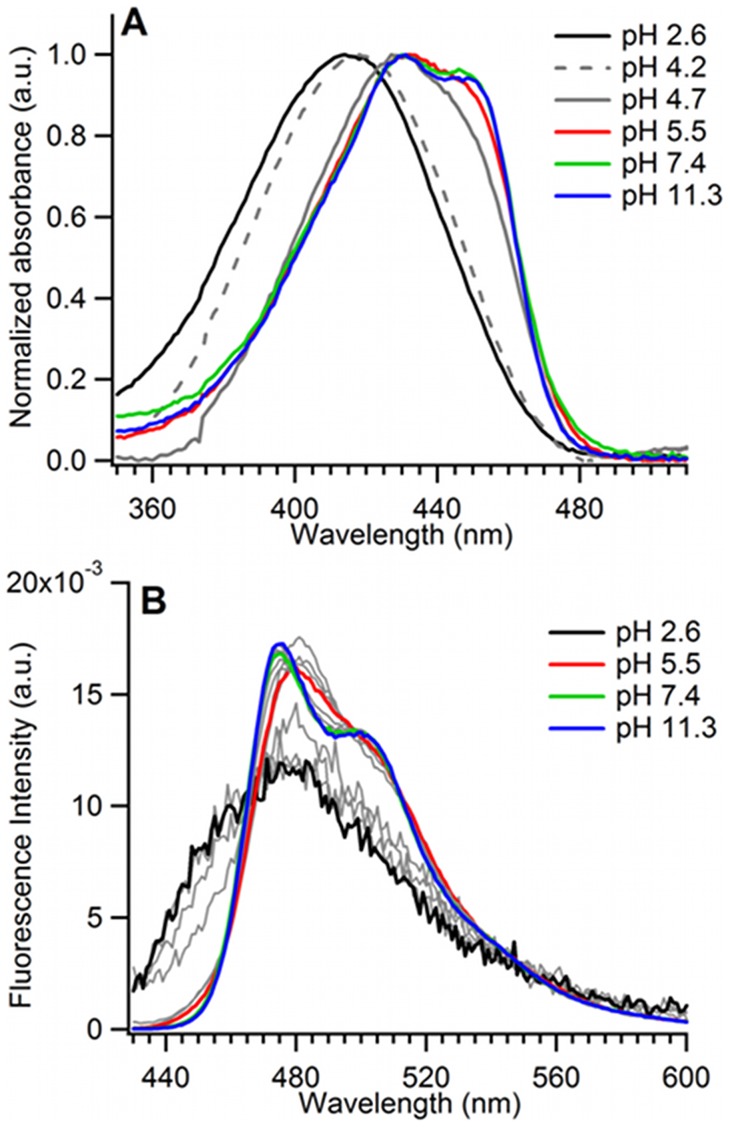
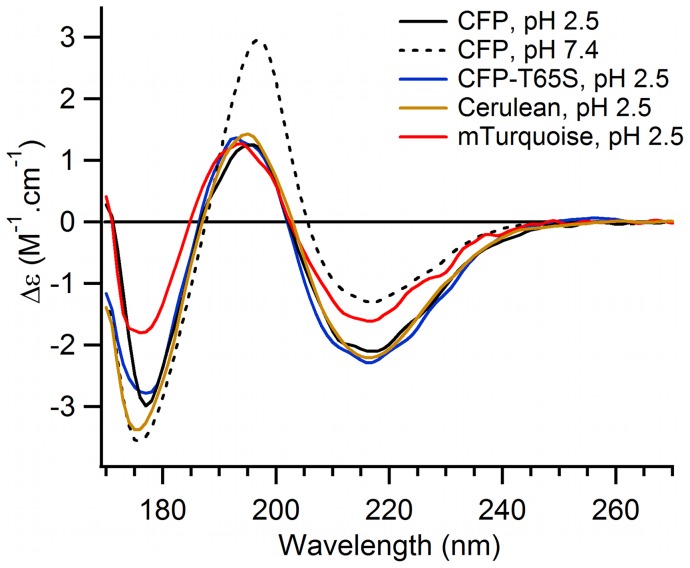
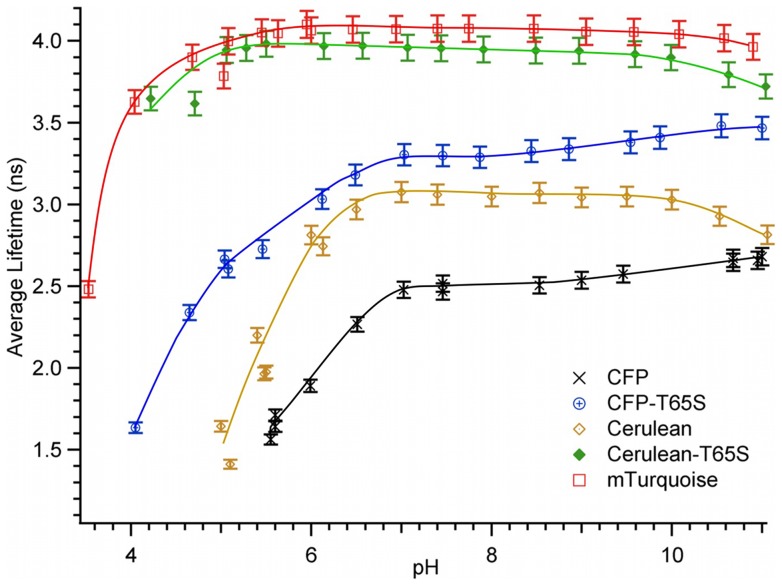
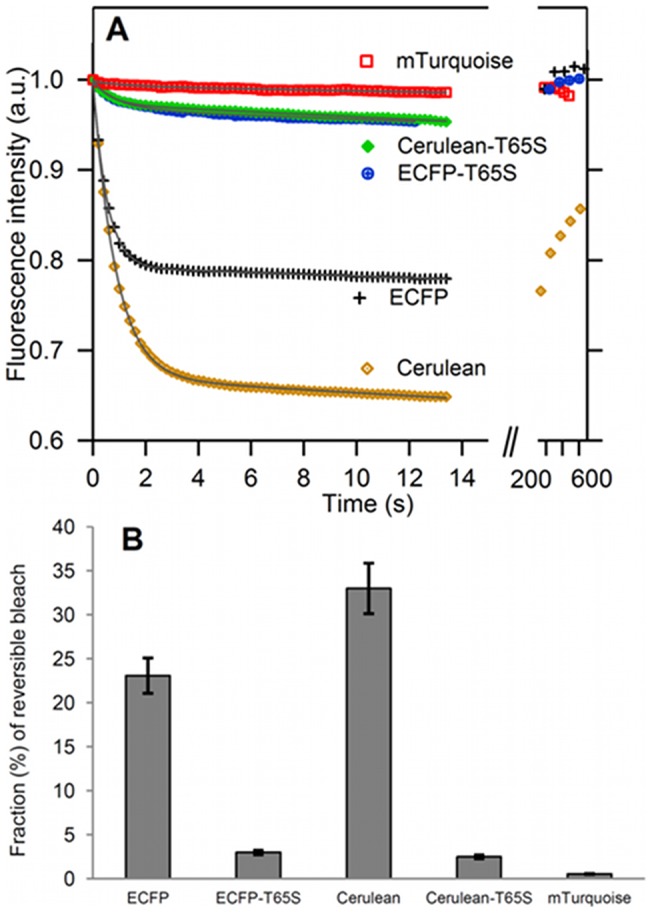
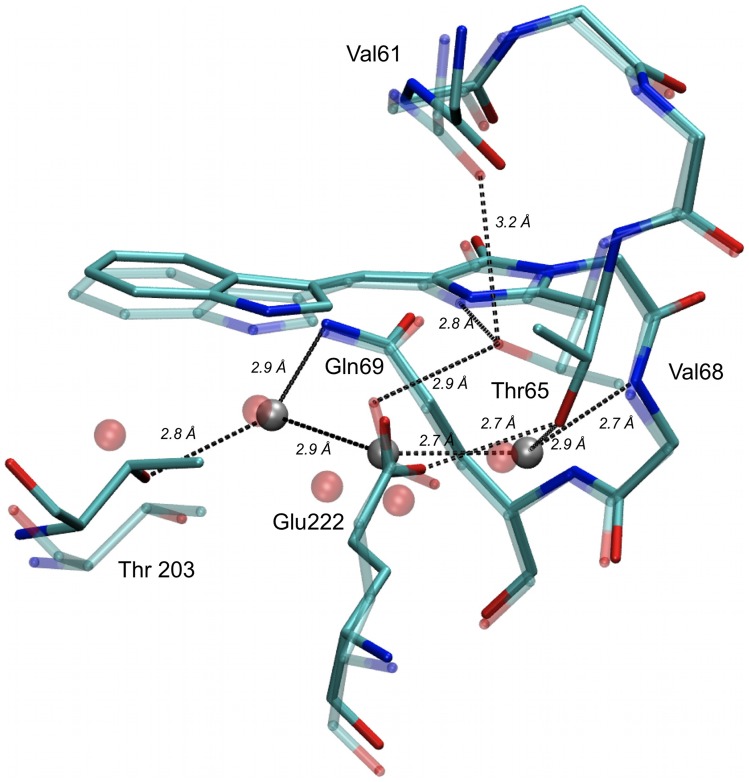
Cyan fluorescent proteins (CFP) derived from Aequorea victoria GFP, carrying a tryptophan-based chromophore, are widely used as FRET donors in live cell fluorescence imaging experiments. Recently, several CFP variants with near-ultimate photophysical performances were obtained through a mix of site-directed and large scale random mutagenesis. To understand the structural bases of these improvements, we have studied more specifically the consequences of the single-site T65S mutation. We find that all CFP variants carrying the T65S mutation not only display an increased fluorescence quantum yield and a simpler fluorescence emission decay, but also show an improved pH stability and strongly reduced reversible photoswitching reactions. Most prominently, the Cerulean-T65S variant reaches performances nearly equivalent to those of mTurquoise, with QY = 0.84, an almost pure single exponential fluorescence decay and an outstanding stability in the acid pH range (pK(1/2) = 3.6). From the detailed examination of crystallographic structures of different CFPs and GFPs, we conclude that these improvements stem from a shift in the thermodynamic balance between two well defined configurations of the residue 65 hydroxyl. These two configurations differ in their relative stabilization of a rigid chromophore, as well as in relaying the effects of Glu222 protonation at acid pHs. Our results suggest a simple method to greatly improve numerous FRET reporters used in cell imaging, and bring novel insights into the general structure-photophysics relationships of fluorescent proteins.


Conflict of interest statement

Competing Interests: Some CFP variants described in this article are the topic of a patent application DI N°1155227. This does not alter the authors' adherence to all the PLOS ONE policies on sharing data and materials. In particular, all plasmids will be freely available upon justified request for the purpose of academic, non-profit research.

Figures

Figure 1
Figure 1. Spectral properties of purified CFP variants at neutral pH.
Absorption (dashed lines) and emission (solid lines) spectra were normalized to maximum of the chromophore band. Emission spectra were recorded with excitation at 420 nm.
Figure 2
Figure 2. Fluorescence lifetime distributions of purified CFP variants at neutral pH.
The distributions are obtained from maximum entropy analysis of the fluorescence decay curves of (A) ECFP, Cerulean and mTurquoise, (B) ECFP and ECFP-T65S and (C) Cerulean and Cerulean-T65S. For each protein, the distribution shown is an average of six independent experiments recorded at pH 7.4 and T = 20°C.
Figure 3
Figure 3. pH dependence of the fluorescence intensity of purified CFP variants.
Fluorescence intensities were excited at 420 nm and detected at 474 nm (Δλ = 6 nm). Solid lines correspond to the best fits to a sigmoidal analytical model. Experimental data were normalized to 100% maximum of their analytical fits.
Figure 4
Figure 4. pH dependence of the spectral properties of purified ECFP.
(A) Absorption spectra normalized to unit maximum absorbance, and (B) emission spectra normalized to unit surface. The spectra corresponding to 50% fluorescence intensity loss (pH = pK1/2) is represented by a continuous red line. The absorption spectrum represented by a dashed gray line corresponds to the first acid pH at which a typical denaturated spectrum is observed.
Figure 5
Figure 5. Synchrotron radiation circular dichroism on purified CFP variants at neutral and acid pHs.
Comparison of the SRCD spectra of ECFP at pH 7.4 (dashed line) and different CFP variants at pH 2.5 (solid lines). The SRCD spectra were recorded at 25°C.
Figure 6
Figure 6. pH dependence of the average fluorescence lifetime of purified CFP variants.
Average lifetimes were determined at 20°C from integration of the corresponding lifetime distributions. Solid lines are for eye guidance only.
Figure 7
Figure 7. Reversible photobleaching of purified CFP variants.
(A) Reversible bleaching kinetics performed on agarose beads labeled with purified CFPs. After prior equilibration in the dark, sudden and constant illumination at 0.2 W/cm2 was applied for less than 15 sec, while camera images were taken every 200 ms. Illumination was then stopped, and, after a minimum of 3 min in the dark, a short series of fluorescence images was collected to check for reversibility. Continuous lines are best fits to the model Fnorm =  y0+y1t+y2 exp(−t/τRev) (see Text S1). (B) Amplitudes of the reversible photobleaching responses of the CFP variants.
Figure 8
Figure 8. Alternate configurations of threonine 65 in the crystallographic structures of ECFP.
Amino-acids and water molecules interacting with the residue 65 hydroxyl are shown, according to the structures of Lelimousin et al (2WSN, solid, grey) and Bae et al (1OXD, transparent, red) . Protein structures were aligned along their main chain backbones, water oxygens are shown as spheres and major H-bonds as dashed lines.

Similar articles

Cited by

References

    1. Zhang J, Allen MD (2007) FRET-based biosensors for protein kinases: illuminating the kinome. Molecular Biosyst 3: 759–765. - PubMed
    1. Balla T (2009) Green light to illuminate signal transduction events. Trends Cell Biol 19: 575–586. - PMC - PubMed
    1. Lu S, Wang Y (2010) Fluorescence resonance energy transfer biosensors for cancer detection and evaluation of drug efficacy. Clin Cancer Res 16: 3822–3824. - PMC - PubMed
    1. Tian L, Looger LL (2008) Genetically encoded fluorescent sensors for studying healthy and diseased nervous systems. Drug Discov Today Dis Models 5: 27–35. - PMC - PubMed
    1. Newman RH, Fosbrink MD, Zhang J (2011) Genetically encodable fluorescent biosensors for tracking signaling dynamics in living cells. Chem Rev 111: 3614–3666. - PMC - PubMed

Publication types