The role of carrion supply in the abundance of deep-water fish off California
- PMID: 23133679
- PMCID: PMC3487845
- DOI: 10.1371/journal.pone.0049332
The role of carrion supply in the abundance of deep-water fish off California
Abstract
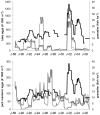
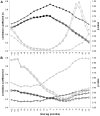
Few time series of deep-sea systems exist from which the factors affecting abyssal fish populations can be evaluated. Previous analysis showed an increase in grenadier abundance, in the eastern North Pacific, which lagged epibenthic megafaunal abundance, mostly echinoderms, by 9-20 months. Subsequent diet studies suggested that carrion is the grenadier's most important food. Our goal was to evaluate if changes in carrion supply might drive the temporal changes in grenadier abundance. We analyzed a unique 17 year time series of abyssal grenadier abundance and size, collected at Station M (4100 m, 220 km offshore of Pt. Conception, California), and reaffirmed the increase in abundance and also showed an increase in mean size resulting in a ∼6 fold change in grenadier biomass. We compared this data with abundance estimates for surface living nekton (pacific hake and jack mackerel) eaten by the grenadiers as carrion. A significant positive correlation between Pacific hake (but not jack mackerel) and grenadiers was found. Hake seasonally migrate to the waters offshore of California to spawn. They are the most abundant nekton species in the region and the target of the largest commercial fishery off the west coast. The correlation to grenadier abundance was strongest when using hake abundance metrics from the area within 100 nmi of Station M. No significant correlation between grenadier abundance and hake biomass for the entire California current region was found. Given the results and grenadier longevity, migration is likely responsible for the results and the location of hake spawning probably is more important than the size of the spawning stock in understanding the dynamics of abyssal grenadier populations. Our results suggest that some abyssal fishes' population dynamics are controlled by the flux of large particles of carrion. Climate and fishing pressures affecting epipelagic fish stocks could readily modulate deep-sea fish dynamics.
Conflict of interest statement
Figures


Similar articles
-
Hydroids (Cnidaria, Hydrozoa) from Mauritanian Coral Mounds.Zootaxa. 2020 Nov 16;4878(3):zootaxa.4878.3.2. doi: 10.11646/zootaxa.4878.3.2. Zootaxa. 2020. PMID: 33311142
-
Long-term change in benthopelagic fish abundance in the abyssal northeast Pacific Ocean.Ecology. 2006 Mar;87(3):549-55. doi: 10.1890/04-1832. Ecology. 2006. PMID: 16602284
-
Phenological and distributional shifts in ichthyoplankton associated with recent warming in the northeast Pacific Ocean.Glob Chang Biol. 2018 Jan;24(1):259-272. doi: 10.1111/gcb.13872. Epub 2017 Sep 26. Glob Chang Biol. 2018. PMID: 28948709
-
The northern shrimp (Pandalus borealis) offshore fishery in the Northeast Atlantic.Adv Mar Biol. 2007;52:147-266. doi: 10.1016/S0065-2881(06)52002-4. Adv Mar Biol. 2007. PMID: 17298891 Review.
-
The biology and fisheries of European hake, Merluccius merluccius, in the north-east Atlantic.Adv Mar Biol. 2010;58:97-154. doi: 10.1016/B978-0-12-381015-1.00002-2. Adv Mar Biol. 2010. PMID: 20959157 Review.
Cited by
-
Fish food in the deep sea: revisiting the role of large food-falls.PLoS One. 2014 May 7;9(5):e96016. doi: 10.1371/journal.pone.0096016. eCollection 2014. PLoS One. 2014. PMID: 24804731 Free PMC article.
-
Direct evidence of an efficient energy transfer pathway from jellyfish carcasses to a commercially important deep-water species.Sci Rep. 2017 Dec 12;7(1):17455. doi: 10.1038/s41598-017-17557-x. Sci Rep. 2017. PMID: 29234052 Free PMC article.
-
Climate-induced changes in the suitable habitat of cold-water corals and commercially important deep-sea fishes in the North Atlantic.Glob Chang Biol. 2020 Apr;26(4):2181-2202. doi: 10.1111/gcb.14996. Epub 2020 Feb 20. Glob Chang Biol. 2020. PMID: 32077217 Free PMC article.
-
High resolution study of the spatial distributions of abyssal fishes by autonomous underwater vehicle.Sci Rep. 2016 May 16;6:26095. doi: 10.1038/srep26095. Sci Rep. 2016. PMID: 27180728 Free PMC article.
-
Bathyal feasting: post-spawning squid as a source of carbon for deep-sea benthic communities.Proc Biol Sci. 2017 Dec 20;284(1869):20172096. doi: 10.1098/rspb.2017.2096. Proc Biol Sci. 2017. PMID: 29263287 Free PMC article.
References
-
- Drazen JC, Popp BN, Choy CA, Clemente T, De Forest LG, et al. (2008) Bypassing the abyssal benthic food-web: macrourid diet in the eastern North Pacific inferred from stomach content and stable isotopes analyses. Limnology and Oceanography 53: 2644–2654.
-
- Pearcy WG, Ambler JW (1974) Food habits of deep-sea fishes off the Oregon coast. Deep Sea Research 21: 745–759.
-
- Gartner JV, Crabtree RE, Sulak KJ (1997) Feeding at depth. In: Randall DJ, Farrell AP, editors. Deep-sea fishes. San Diego: Academic Press. 115–193.
-
- Crabtree RE, Carter J, Musick JA (1991) The comparative feeding ecology of temperate and tropical deep-sea fishes from the western North Atlantic. Deep Sea Research 38: 1277–1298.
-
- Worm B, Barbier EB, Beaumont N, Duffy E, Folke C, et al. (2006) Impacts of Biodiversity Loss on Ocean Ecosystem Services. Science 314: 787–790. - PubMed
Publication types
MeSH terms
Substances
LinkOut - more resources
Full Text Sources
Miscellaneous

