

Development of NGR peptide-based agents for tumor imaging
- PMID: 23133793
- PMCID: PMC3477716
Development of NGR peptide-based agents for tumor imaging
Abstract
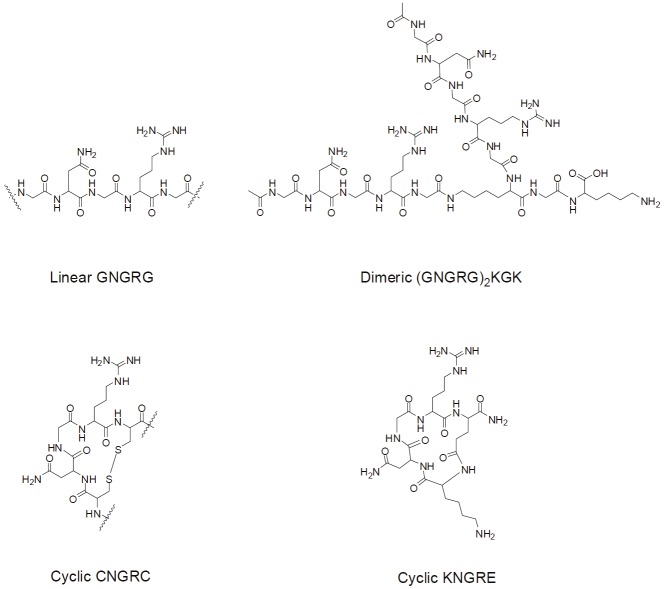
Molecular imaging allows direct visualization of targets and characterization of cellular pathways, as long as a high signal/background ratio can be achieved, which requires a sufficient amount of probes to accumulate in the imaging region. The Asn-Gly-Arg (NGR) tripeptide selected by phage display can specifically target tumor vasculature. Recognizing the aminopeptidase N (APN or CD13) receptor on the membrane of tumor cells, the peptide can be further internalized into cytoplasma by the endosomal pathway. Hence NGR can serve as an ideal candidate for tumor imaging, once it is conjugated with fluorescent or radiolabeled imaging probes. Herein, we highlight some recent developments of NGR peptide based imaging of tumors. Although still in the preliminary stage, some NGR probes have shown potential as promising agents in future clinical applications.
Keywords: Asparagine-glycine-arginine (NGR); aminopeptidase N (APN/CD13); arginine-glycine-aspartic acid (RGD); cancer; imaging; isoaspartate-glycine-arginine (isoDGR); tumor angiogenesis; vasculature.
Figures
Similar articles
-
In vivo imaging of Aminopeptidase N (CD13) receptors in experimental renal tumors using the novel radiotracer (68)Ga-NOTA-c(NGR).Eur J Pharm Sci. 2015 Mar 10;69:61-71. doi: 10.1016/j.ejps.2015.01.002. Epub 2015 Jan 13. Eur J Pharm Sci. 2015. PMID: 25592229
-
In vivo assessment of aminopeptidase N (APN/CD13) specificity of different 68Ga-labelled NGR derivatives using PET/MRI imaging.Int J Pharm. 2020 Nov 15;589:119881. doi: 10.1016/j.ijpharm.2020.119881. Epub 2020 Sep 16. Int J Pharm. 2020. PMID: 32946975
-
68Ga-DOTA-NGR as a novel molecular probe for APN-positive tumor imaging using MicroPET.Nucl Med Biol. 2014 Mar;41(3):268-75. doi: 10.1016/j.nucmedbio.2013.12.008. Epub 2013 Dec 18. Nucl Med Biol. 2014. PMID: 24438818
-
Radiolabeled NGR-Based Heterodimers for Angiogenesis Imaging: A Review of Preclinical Studies.Cancers (Basel). 2023 Sep 7;15(18):4459. doi: 10.3390/cancers15184459. Cancers (Basel). 2023. PMID: 37760428 Free PMC article. Review.
-
NGR-Based Radiopharmaceuticals for Angiogenesis Imaging: A Preclinical Review.Int J Mol Sci. 2023 Aug 11;24(16):12675. doi: 10.3390/ijms241612675. Int J Mol Sci. 2023. PMID: 37628856 Free PMC article. Review.
Cited by
-
A-NGR fusion protein induces apoptosis in human cancer cells.EXCLI J. 2018 Jun 25;17:590-597. doi: 10.17179/excli2018-1120. eCollection 2018. EXCLI J. 2018. PMID: 30108463 Free PMC article.
-
A Review on Green Synthesis, Biomedical Applications, and Toxicity Studies of ZnO NPs.Bioinorg Chem Appl. 2018 Aug 1;2018:3569758. doi: 10.1155/2018/3569758. eCollection 2018. Bioinorg Chem Appl. 2018. PMID: 30154832 Free PMC article. Review.
-
NGR-peptide-drug conjugates with dual targeting properties.PLoS One. 2017 Jun 2;12(6):e0178632. doi: 10.1371/journal.pone.0178632. eCollection 2017. PLoS One. 2017. PMID: 28575020 Free PMC article.
-
Positron emission tomography imaging of tumor angiogenesis with a (61/64)Cu-labeled F(ab')(2) antibody fragment.Mol Pharm. 2013 Feb 4;10(2):709-16. doi: 10.1021/mp300507r. Epub 2013 Jan 14. Mol Pharm. 2013. PMID: 23316869 Free PMC article.
-
Biomedical applications of zinc oxide nanomaterials.Curr Mol Med. 2013 Dec;13(10):1633-45. doi: 10.2174/1566524013666131111130058. Curr Mol Med. 2013. PMID: 24206130 Free PMC article. Review.
References
-
- Jemal A, Siegel R, Ward E, Hao Y, Xu J, Murray T, Thun MJ. Cancer statistics, 2008. CA Cancer J Clin. 2008;58:71–96. - PubMed
-
- Friedmann T. The development of human gene therapy. Cold Spring Harbor: Cold Spring Harbor Laboratory Press; 1998.
-
- Rhim JS. Molecular and genetic mechanisms of prostate cancer. Radiat Res. 2001;155:128–132. - PubMed
-
- Garde SV, Forte AJ, Ge M, Lepekhin EA, Panchal CJ, Rabbani SA, Wu JJ. Binding and internalization of NGR-peptide-targeted liposomal doxorubicin (TVT-DOX) in CD13-expressing cells and its antitumor effects. Anticancer Drugs. 2007;18:1189–1200. - PubMed
-
- Lei H, Cao P, Miao G, Lin Z, Diao Z. Expression and functional characterization of tumor-targeted fusion protein composed of NGR peptide and 15-kDa actin fragment. Appl Biochem Biotechnol. 2010;162:988–995. - PubMed
LinkOut - more resources
Full Text Sources
Other Literature Sources
Miscellaneous