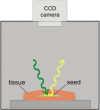
Multispectral visualization of surgical safety-margins using fluorescent marker seeds
- PMID: 23133810
- PMCID: PMC3477729
Multispectral visualization of surgical safety-margins using fluorescent marker seeds
Abstract
Optical guidance provided by luminescent marker seeds may be suitable for intraoperative determination of appropriate resection margins. In phantom studies we compared the tissue penetration of several organic dyes and inorganic particles (quantum dots; QDs) after incorporation in experimental marker seeds. The tissue penetration of (near infra-) red organic dyes was much better than the penetration of dyes and QDs with an emission in the visible range. By combining 3 dyes in a single marker seed we were able to distinguish four depth ranges. The difference in tissue penetration between the dyes and QDS enabled depth estimation via a 'traffic light' approach.
Keywords: Surgical guidance; fluorescence; marker seeds; phantom studies; tissue penetration.
Figures


Similar articles
-
Tumor bracketing and safety margin estimation using multimodal marker seeds: a proof of concept.J Biomed Opt. 2010 Sep-Oct;15(5):056021. doi: 10.1117/1.3503955. J Biomed Opt. 2010. PMID: 21054115
-
Multiphoton Deep-Tissue Imaging of Micrometastases and Disseminated Cancer Cells Using Conjugates of Quantum Dots and Single-Domain Antibodies.Methods Mol Biol. 2021;2350:105-123. doi: 10.1007/978-1-0716-1593-5_8. Methods Mol Biol. 2021. PMID: 34331282
-
[Quantitative determination of pazufloxacin using water-soluble quantum dots as fluorescent probes].Guang Pu Xue Yu Guang Pu Fen Xi. 2008 Jun;28(6):1317-21. Guang Pu Xue Yu Guang Pu Fen Xi. 2008. PMID: 18800713 Chinese.
-
Characterization of water-soluble luminescent quantum dots by fluorescence correlation spectroscopy.Ann N Y Acad Sci. 2008;1130:253-61. doi: 10.1196/annals.1430.029. Ann N Y Acad Sci. 2008. PMID: 18596356 Review.
-
Biocompatible Semiconductor Quantum Dots as Cancer Imaging Agents.Adv Mater. 2018 May;30(18):e1706356. doi: 10.1002/adma.201706356. Epub 2018 Feb 22. Adv Mater. 2018. PMID: 29468747 Review.
Cited by
-
Antibody-based imaging of HER-2: moving into the clinic.Curr Mol Med. 2013 Dec;13(10):1523-37. doi: 10.2174/1566524013666131111120951. Curr Mol Med. 2013. PMID: 24206138 Free PMC article. Review.
-
Bimodal imaging probes for combined PET and OI: recent developments and future directions for hybrid agent development.Biomed Res Int. 2014;2014:153741. doi: 10.1155/2014/153741. Epub 2014 Apr 16. Biomed Res Int. 2014. PMID: 24822177 Free PMC article. Review.
-
Multimodality imaging of RNA interference.Curr Med Chem. 2013;20(29):3664-75. doi: 10.2174/0929867311320290012. Curr Med Chem. 2013. PMID: 23745567 Free PMC article. Review.
-
Multispectral fluorescence guided surgery; a feasibility study in a phantom using a clinical-grade laparoscopic camera system.Am J Nucl Med Mol Imaging. 2017 Jul 15;7(3):138-147. eCollection 2017. Am J Nucl Med Mol Imaging. 2017. PMID: 28721307 Free PMC article.
-
Functionalized upconversion nanoparticles: versatile nanoplatforms for translational research.Curr Mol Med. 2013 Dec;13(10):1613-32. doi: 10.2174/1566524013666131111122133. Curr Mol Med. 2013. PMID: 24206131 Free PMC article. Review.
References
-
- Buckle T, Chin PTK, van den Berg NS, Loo CE, Koops W, Gilhuijs KG, van Leeuwen FWB. Tumor bracketing and safety margin estimation using multimodal marker seeds: a proof of concept. J Biomed Opt. 2010;15:56021–56028. - PubMed
-
- Terasaki H, Miyake Y, Awaya S. Fluorescein angiography of peripheral retina and pars plana during vitrectomy for proliferative diabetic retinopathy. Am J Ophthalmol. 1997;123:370–376. - PubMed
-
- Alsagoff Z, Chew PTK, Chee CKL, Wong JS, Aung T. Indocyanine green anterior segment angiography for studying conjunctival vascular changes after trabeculectomy. Clin Experiment Ophthalmol. 2001;29:22–26. - PubMed
-
- Tagaya N, Yamazaki R, Nakagawa A, Abe A, Hamada K, Oyama T. Intraoperative identification of sentinel lymph nodes by near-infrared fluorescence imaging in patients with breast cancer. Am J Surg. 2008;195:850–853. - PubMed
-
- Kitai T, Inomoto T, Miwa M, Shikayama T. Fluorescence navigation with indocyanine green for detecting sentinel lymph nodes in breast cancer. Breast Cancer. 2005;12:211–215. - PubMed
LinkOut - more resources
Full Text Sources
