Identifying gene networks underlying the neurobiology of ethanol and alcoholism
- PMID: 23134046
- PMCID: PMC3860407
Identifying gene networks underlying the neurobiology of ethanol and alcoholism
Abstract
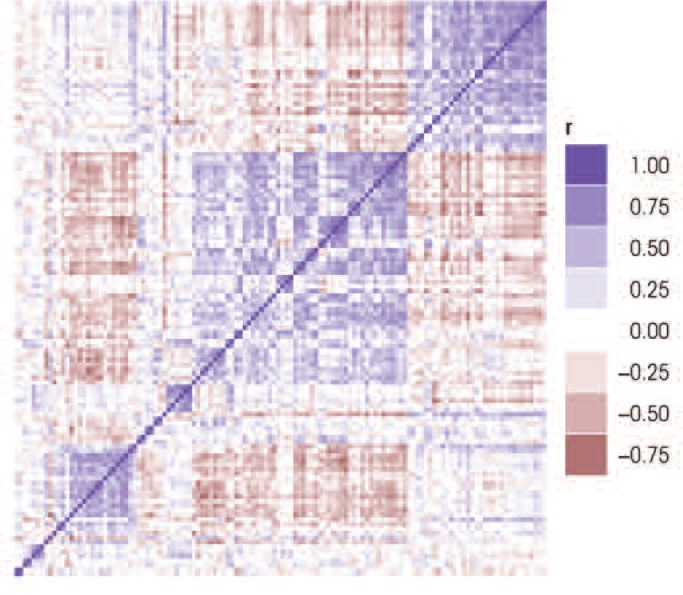
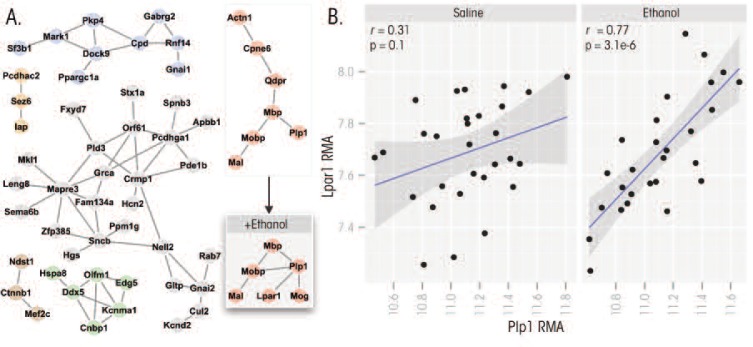
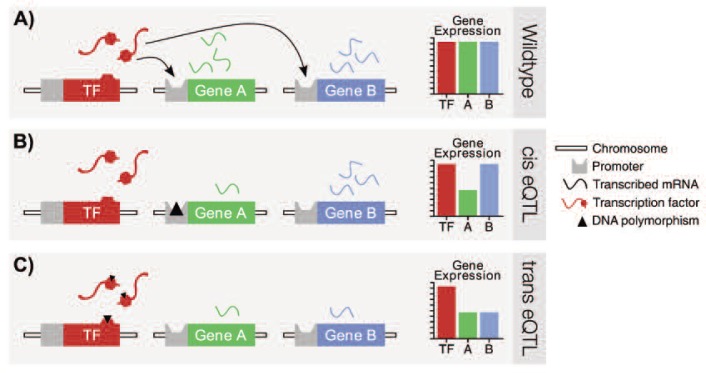
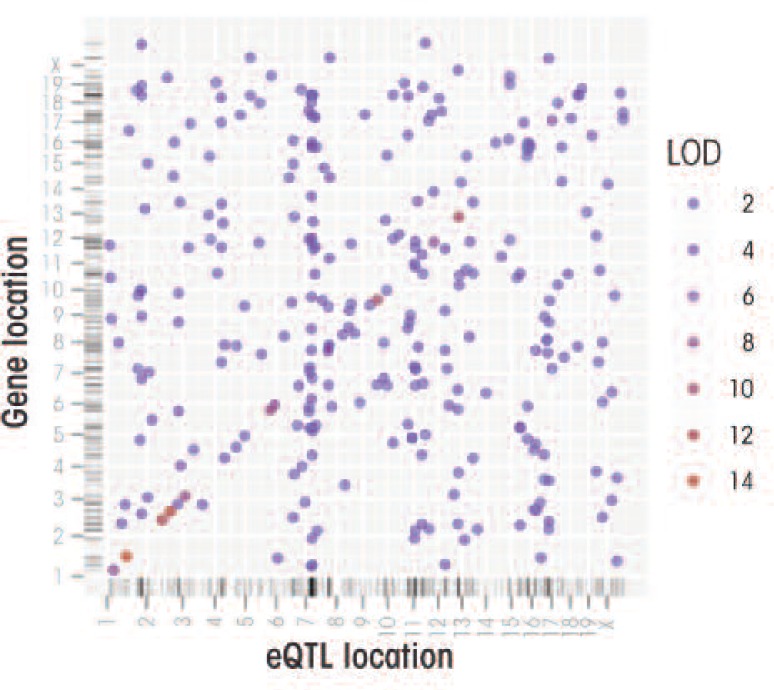
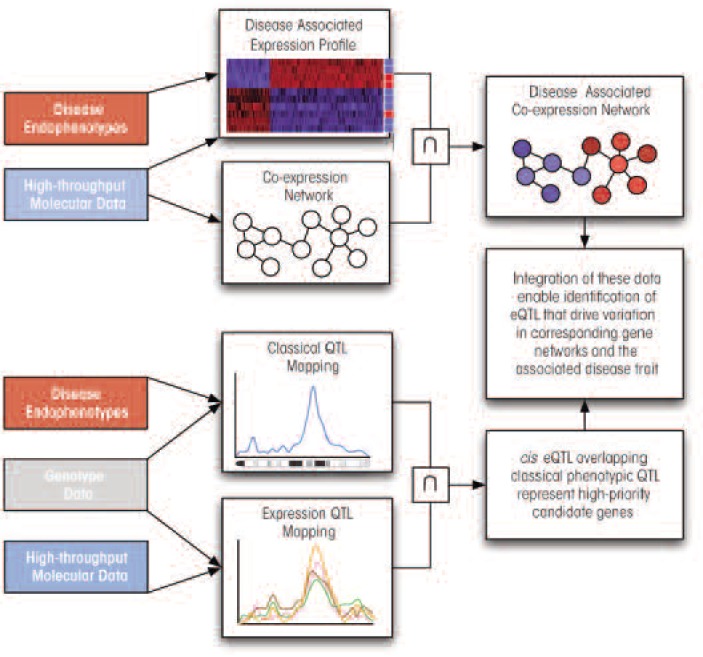
For complex disorders such as alcoholism, identifying the genes linked to these diseases and their specific roles is difficult. Traditional genetic approaches, such as genetic association studies (including genome-wide association studies) and analyses of quantitative trait loci (QTLs) in both humans and laboratory animals already have helped identify some candidate genes. However, because of technical obstacles, such as the small impact of any individual gene, these approaches only have limited effectiveness in identifying specific genes that contribute to complex diseases. The emerging field of systems biology, which allows for analyses of entire gene networks, may help researchers better elucidate the genetic basis of alcoholism, both in humans and in animal models. Such networks can be identified using approaches such as high-throughput molecular profiling (e.g., through microarray-based gene expression analyses) or strategies referred to as genetical genomics, such as the mapping of expression QTLs (eQTLs). Characterization of gene networks can shed light on the biological pathways underlying complex traits and provide the functional context for identifying those genes that contribute to disease development.
Figures
Similar articles
-
Integrative Analysis of Genetic, Genomic, and Phenotypic Data for Ethanol Behaviors: A Network-Based Pipeline for Identifying Mechanisms and Potential Drug Targets.Methods Mol Biol. 2017;1488:531-549. doi: 10.1007/978-1-4939-6427-7_26. Methods Mol Biol. 2017. PMID: 27933543 Free PMC article.
-
Using expression genetics to study the neurobiology of ethanol and alcoholism.Int Rev Neurobiol. 2010;91:95-128. doi: 10.1016/S0074-7742(10)91004-0. Int Rev Neurobiol. 2010. PMID: 20813241 Free PMC article. Review.
-
Ethanol modulation of gene networks: implications for alcoholism.Neurobiol Dis. 2012 Jan;45(1):115-21. doi: 10.1016/j.nbd.2011.04.013. Epub 2011 Apr 22. Neurobiol Dis. 2012. PMID: 21536129 Free PMC article. Review.
-
The genetic basis of alcoholism: multiple phenotypes, many genes, complex networks.Genome Biol. 2012 Feb 20;13(2):239. doi: 10.1186/gb-2012-13-2-239. Genome Biol. 2012. PMID: 22348705 Free PMC article. Review.
-
Assessing the genetic risk for alcohol use disorders.Alcohol Res. 2012;34(3):266-72. Alcohol Res. 2012. PMID: 23134042 Free PMC article.
Cited by
-
Cross-Species Co-analysis of Prefrontal Cortex Chronic Ethanol Transcriptome Responses in Mice and Monkeys.Front Mol Neurosci. 2019 Aug 13;12:197. doi: 10.3389/fnmol.2019.00197. eCollection 2019. Front Mol Neurosci. 2019. PMID: 31456662 Free PMC article.
-
Molecular and neurologic responses to chronic alcohol use.Handb Clin Neurol. 2014;125:157-71. doi: 10.1016/B978-0-444-62619-6.00010-0. Handb Clin Neurol. 2014. PMID: 25307574 Free PMC article. Review.
-
Genome-wide transcriptomics of the amygdala reveals similar oligodendrocyte-related responses to acute and chronic alcohol drinking in female mice.Transl Psychiatry. 2022 Nov 12;12(1):476. doi: 10.1038/s41398-022-02231-2. Transl Psychiatry. 2022. PMID: 36371333 Free PMC article.
-
Relationships between reward sensitivity, risk-taking and family history of alcoholism during an interactive competitive fMRI task.PLoS One. 2014 Feb 4;9(2):e88188. doi: 10.1371/journal.pone.0088188. eCollection 2014. PLoS One. 2014. PMID: 24505424 Free PMC article.
-
Identification of quantitative trait loci and candidate genes for an anxiolytic-like response to ethanol in BXD recombinant inbred strains.Genes Brain Behav. 2016 Apr;15(4):367-81. doi: 10.1111/gbb.12289. Genes Brain Behav. 2016. PMID: 26948279 Free PMC article.
References
-
- Albert R, Jeong H. Internet: Diameter of the World-Wide Web. Nature. 1999;401:130–131.
-
- Bailey DW. Recombinant-inbred strains: An aid to finding identity, linkage, and function of histocompatibility and other genes. Transplantation. 1971;11(3):325–327. - PubMed
-
- Belknap JK, Atkins AL. The replicability of QTLs for murine alcohol preference drinking behavior across eight independent studies. Mammalian Genome. 2001;12(12):893–899. - PubMed
-
- Bennett B, Beeson M, Gordon L, Johnson TE. Reciprocal congenics defining individual quantitative trait loci for sedative/hypnotic sensitivity to ethanol. Alcoholism: Clinical and Experimental Research. 2002;26(2):149–157. - PubMed
Publication types
MeSH terms
Substances
LinkOut - more resources
Full Text Sources
Medical