

Metabolic and biochemical effects of low-to-moderate alcohol consumption
- PMID: 23134229
- PMCID: PMC3568441
- DOI: 10.1111/acer.12015
Metabolic and biochemical effects of low-to-moderate alcohol consumption
Abstract
Background: Alcohol consumption has multiple biochemical consequences. Only a few of these are useful as diagnostic markers, but many reflect potentially harmful or beneficial effects of alcohol. Average consumption of 2 to 4 drinks per day is associated with lower overall or cardiovascular mortality risk than either lower or higher intake. We have analyzed the dose-response relationships between reported alcohol consumption and 17 biomarkers, with emphasis on intake of up to 3 drinks per day.
Methods: Biochemical tests were performed on serum from 8,396 study participants (3,750 men and 4,646 women, aged 51 ± 13 years, range 18 to 93) who had provided information on alcohol consumption in the week preceding blood collection.
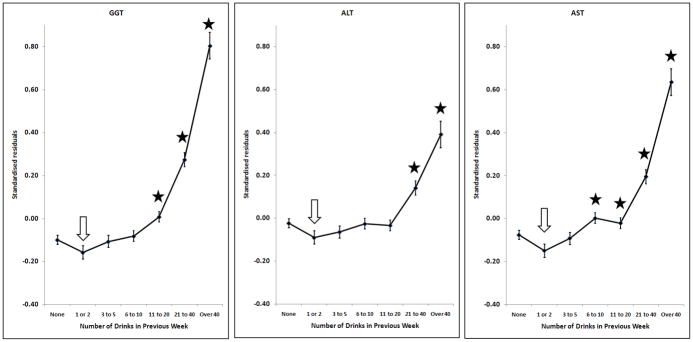
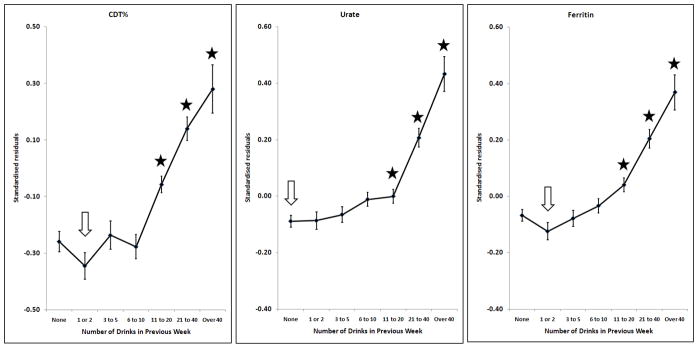
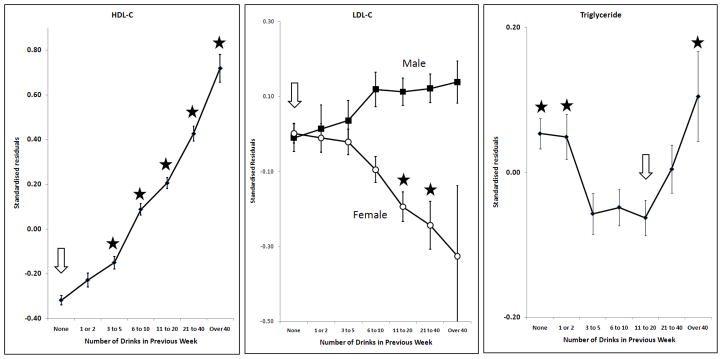
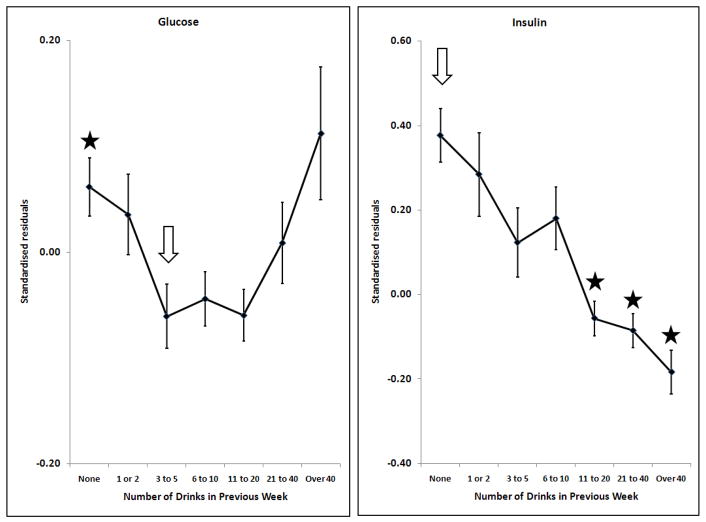
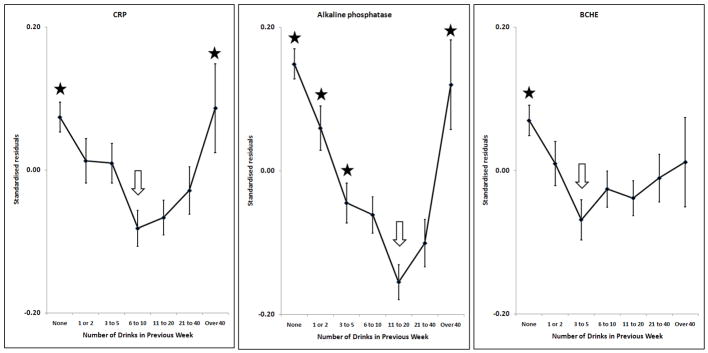
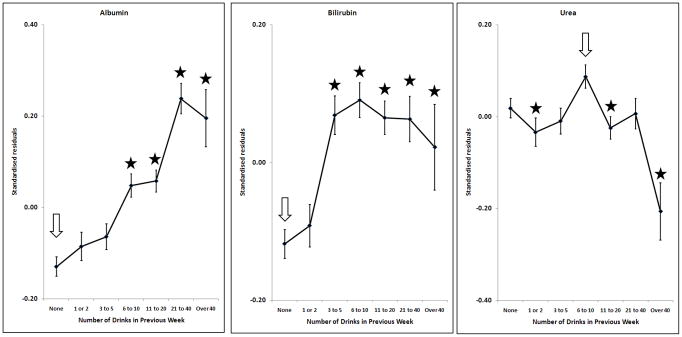
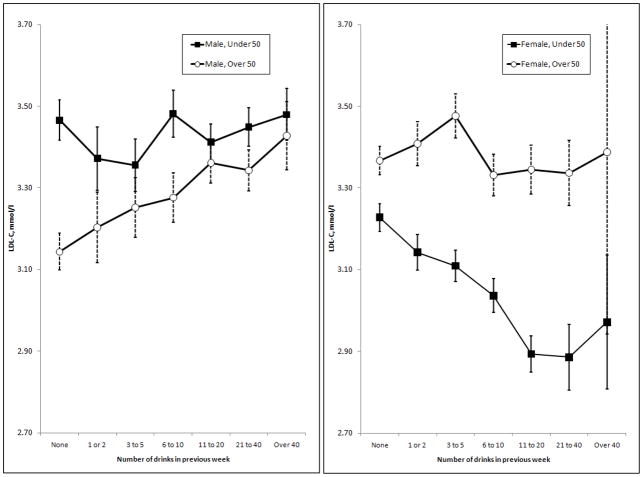
Results: Gamma glutamyl transferase, alanine aminotransferase, aspartate aminotransferase, carbohydrate-deficient transferrin, urate, ferritin, and bilirubin showed little or no change with alcohol consumption below 2 to 3 drinks per day, but increased with higher intake. High-density lipoprotein cholesterol and albumin showed increasing results, and insulin showed decreasing results, across the entire range of alcohol use. Biphasic responses, where subjects reporting 1 to 2 drinks per day had lower results than those reporting either more or less alcohol use, occurred for triglycerides, glucose, C-reactive protein, alkaline phosphatase, and butyrylcholinesterase. Increasing alcohol use was associated with decreasing low-density lipoprotein cholesterol (LDL-C) in younger women, but higher LDL-C in older men.
Conclusions: Some markers show threshold relationships with alcohol, others show continuous ones, and a third group show biphasic or U-shaped relationships. Overall, the biochemical sequelae of low-to-moderate alcohol use are consistent with the epidemiological evidence on morbidity and mortality.
Copyright © 2012 by the Research Society on Alcoholism.
Figures
References
-
- Alatalo P, Koivisto H, Puukka K, Hietala J, Anttila P, Bloigu R, Niemela O. Biomarkers of liver status in heavy drinkers, moderate drinkers and abstainers. Alcohol Alcohol. 2009;44:199–203. - PubMed
-
- Albert MA, Glynn RJ, Ridker PM. Alcohol consumption and plasma concentration of C-reactive protein. Circulation. 2003;107:443–447. - PubMed
-
- Alberti KG, Zimmet P, Shaw J. Metabolic syndrome--a new world-wide definition. A Consensus Statement from the International Diabetes Federation. Diabet Med. 2006;23:469–480. - PubMed
-
- Alkerwi A, Boutsen M, Vaillant M, Barre J, Lair ML, Albert A, Guillaume M, Dramaix M. Alcohol consumption and the prevalence of metabolic syndrome: a meta-analysis of observational studies. Atherosclerosis. 2009;204:624–635. - PubMed
-
- Alte D, Ludemann J, Piek M, Adam C, Rose HJ, John U. Distribution and dose response of laboratory markers to alcohol consumption in a general population: results of the study of health in Pomerania (SHIP) J Stud Alcohol. 2003;64:75–82. - PubMed
Publication types
MeSH terms
Substances
Grants and funding
- DA019951/DA/NIDA NIH HHS/United States
- AA013320/AA/NIAAA NIH HHS/United States
- AA013326/AA/NIAAA NIH HHS/United States
- R01 DA012854/DA/NIDA NIH HHS/United States
- AA013321/AA/NIAAA NIH HHS/United States
- R01 AA013320/AA/NIAAA NIH HHS/United States
- R01 AA014041/AA/NIAAA NIH HHS/United States
- K05 AA017688/AA/NIAAA NIH HHS/United States
- R01 AA013326/AA/NIAAA NIH HHS/United States
- R56 DA012854/DA/NIDA NIH HHS/United States
- DA012854/DA/NIDA NIH HHS/United States
- R01 AA013321/AA/NIAAA NIH HHS/United States
- AA014041/AA/NIAAA NIH HHS/United States
- K08 DA019951/DA/NIDA NIH HHS/United States
LinkOut - more resources
Full Text Sources
Medical
Research Materials
