. 2013 Jan;37(1):118-29.
doi: 10.1111/ejn.12027. Epub 2012 Nov 8.

Immunohistological and electrophysiological evidence that N-acetylaspartylglutamate is a co-transmitter at the vertebrate neuromuscular junction

Affiliations

Immunohistological and electrophysiological evidence that N-acetylaspartylglutamate is a co-transmitter at the vertebrate neuromuscular junction

Kathryn K Walder et al. Eur J Neurosci. 2013 Jan.

Abstract

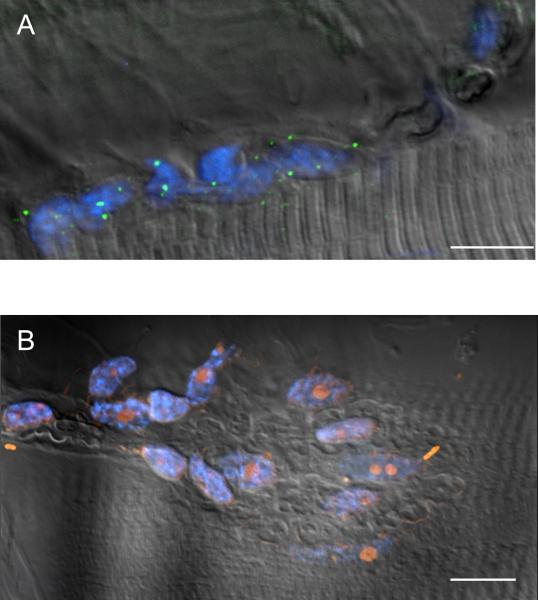
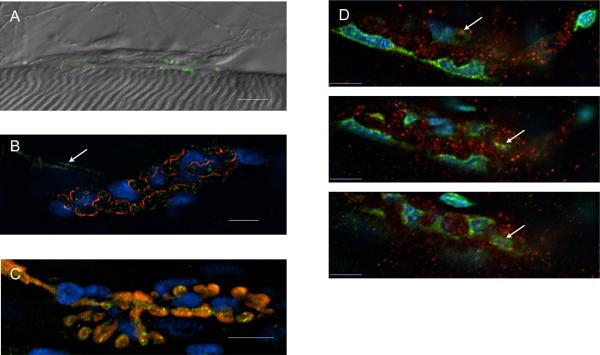
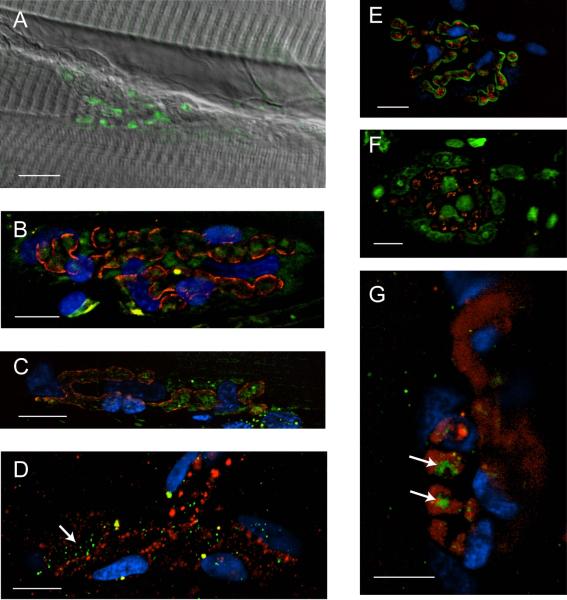
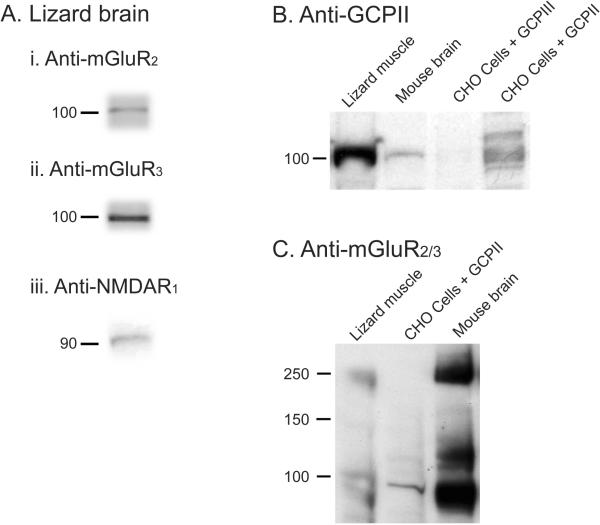
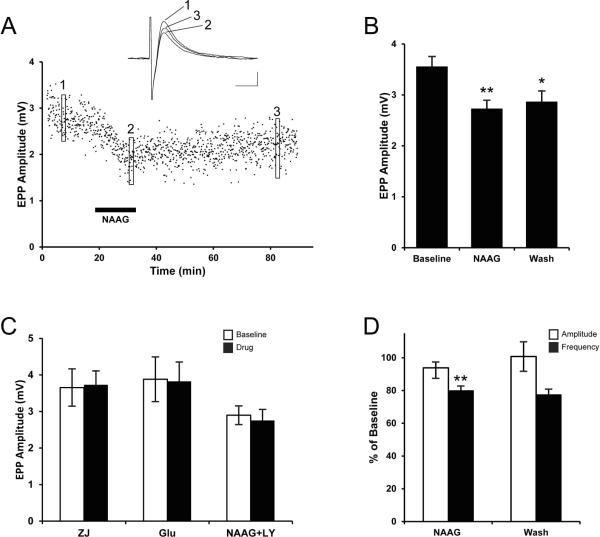
Immunohistochemical studies previously revealed the presence of the peptide transmitter N-acetylaspartylglutamate (NAAG) in spinal motor neurons, axons and presumptive neuromuscular junctions (NMJs). At synapses in the central nervous system, NAAG has been shown to activate the type 3 metabotropic glutamate receptor (mGluR3) and is inactivated by an extracellular peptidase, glutamate carboxypeptidase II. The present study tested the hypothesis that NAAG meets the criteria for classification as a co-transmitter at the vertebrate NMJ. Confocal microscopy confirmed the presence of NAAG immunoreactivity and extended the resolution of the peptide's location in the lizard (Anolis carolinensis) NMJ. NAAG was localised to a presynaptic region immediately adjacent to postsynaptic acetylcholine receptors. NAAG was depleted by potassium-induced depolarisation and by electrical stimulation of motor axons. The NAAG receptor, mGluR3, was localised to the presynaptic terminal consistent with NAAG's demonstrated role as a regulator of synaptic release at central synapses. In contrast, glutamate receptors, type 2 metabotropic glutamate receptor (mGluR2) and N-methyl-d-aspartate, were closely associated with acetylcholine receptors in the postsynaptic membrane. Glutamate carboxypeptidase II, the NAAG-inactivating enzyme, was identified exclusively in perisynaptic glial cells. This localisation was confirmed by the loss of immunoreactivity when these cells were selectively eliminated. Finally, electrophysiological studies showed that exogenous NAAG inhibited evoked neurotransmitter release by activating a group II metabotropic glutamate receptor (mGluR2 or mGluR3). Collectively, these data support the conclusion that NAAG is a co-transmitter at the vertebrate NMJ.


Figures

Figure 1
Figure 1. NAAG is present at the lizard NMJ
A. NAAG (green) is present at the lizard NMJ junction, imaged using differential interference contrast (DIC), and is not in the muscle cells (N=11, n=165). B. Separate planes from a 3D Z-stack of a terminal stained for NAAG (green) and nicotinic ACh receptors using α-bungarotoxin (red). The Z-stack is presented in 1μm increments vertically through the field. Zoom of B shows that NAAG is consistently encapsulated within the nerve terminal. C. Two neighboring synapses show variability in presence of NAAG (green) within the nerve terminal (red, α-bungarotoxin). 73% of synapses had NAAG present at time of fixation (see figure 2). The image shown is a maximum projection of 16 images collected at 0.5 μm increments vertically through the field containing the NMJ. D. NAAG (green) does not always fill the whole terminal (red, α-bungarotoxin). The middle set of boutons still retains its NAAG, while the upper and lower sets of boutons are devoid of NAAG immunofluorescence. The image shown is a maximum projection of 21 images collected at 0.27 μm increments vertically through the field containing the NMJ. Calibration bars, 10 μm.
Figure 2
Figure 2. NAAG depletion and immunohistochemical staining in synaptic vesicles
A. In contrast to muscles bathed in normal saline (N=5), muscles incubated in high [K+] saline for 15 minutes prior to fixation (N=5) contained significantly fewer synapses with detectable NAAG. The difference in the percentage of synapse containing NAAG after being incubated for 15 minutes in saline with low [K+] and no Ca2+ (N=4) was highly significantly different from the percentage observed in muscles incubated in high [K+] saline. Asterisks indicate the means are significantly different. * P=0.0027, **P=2.8×10⁻⁹. B. The distribution of NAAG (red) is different from AM1-44 (green) following modest stimulation (0.5 Hz, 48 seconds). Inset shows a zoomed image in which NAAG can be seen preferentially located in the interior of the nerve terminal, whereas AM1-44 is concentrated in the periphery (N=2, n=40). For clarity of presentation, the color of the NAAG immunofluorescence was changed from blue to red; however, the secondary antibody was actually conjugated to AlexaFluor 350. The AM-1-44 emission spans both green and red. For clarity, only the green channel is displayed here; however, the pattern of staining is identical in the red channel. C. NAAG (green) is co-distributed with Alexa 595 Dextran (red) back-loaded into the nerve terminal (N=2, n=20). The panels display the fluorescence emission using a Texas Red filter cube (TR), a FITC filter cube (NAAG), and the superimposed images of both (merge). Calibration bars, 10 μm.
Figure 3
Figure 3. Immunohistochemical staining of NAAG hydrolase enzyme, GCPII
A. Perisynaptic Schwann Cell (PSC) unablated preparation shows GCPII (green) stain at the nerve terminal (DAPI in blue indicating PSC nuclei). (N=4, n=100). B. Ablated preparation lacks GCPII (green) where ablated PSCs are marked with EthD-1 (red) and DAPI (blue) (N=2, n=50). For both panels A and B, an image collected using DIC optics is superimposed onto fluorescent images collected using DAPI, FITC and TRITC filter cubes. Calibration bars, 10 μm.
Figure 4
Figure 4. Immunohistochemical staining of the NAAG receptor, mGluR3
A. mGluR3 (green) is present at the lizard NMJ. The immunofluorescence image showing mGluR3 is superimposed on an image collected at the same NMJ using DIC. (N=4, n=56). B. mGluR3 (green) is localized to the synapse, marked with α-bungarotoxin (red) and DAPI (blue) but cannot be localized to a cell type. The motor axon, marked with the arrow, appears to contain mGluR3 (N=2, n=40). C. mGluR3 (green) is contained within the motor nerve terminal, which has been back-loaded with Alexa 595 Dextran (red). The DAPI (blue) indicates PSC nuclei. The image shown is a maximum projection of 8 images collected at 0.5 μm increments vertically through the field containing the NMJ. (N=2, n=23). D. 3 planes from a Z-stack collected in 2 μm increments. mGluR3 (red) is localized primarily to the presynaptic terminal, although these images do not rule out some overlap with the PSCs (DAPI, blue and Yoyo-1, green) as indicated with the arrows. (N=2, n=50). Calibration bars, 10 μm.
Figure 5
Figure 5. Immunohistochemical staining of glutamate receptors metabotropic glutamate receptor type 2 and N-Methyl-D-aspartate receptor 1
A. mGluR2 (green) staining at the terminal. The immunofluorescence image showing mGluR2 is superimposed on an image collected at the same NMJ using DIC. B. mGluR2 (green) is localized to the synapse outlined with α-bungarotoxin (red) but its specific localization is ambiguous. The PSCs are labeled with DAPI (blue). The image shown is a maximum projection of 5 images collected at 0.5 μm increments vertically through the field containing the NMJ. (N=2, n=220). C. The distribution of mGluR2 is unaltered by PSC ablation. Ablated preparation shows mGluR2 (green) within outline created by α-bungarotoxin (red). The image shown is a maximum projection of 10 images collected at 0.5 μm increments vertically through the field containing the NMJ. (N=2, n=50). D. mGluR2 (green) is not contained within the motor nerve terminal, which has been back-loaded with Alexa 595 Dextran (red). The DAPI (blue) indicates PSC nuclei. mGluR2 receptors thought to be in the muscle membrane are marked with the arrow. (N=4, n=22). E. NMDAR1 (red) is localized to the postsynaptic end plate, outlined with α-bungarotoxin (green) (N=2, n=50) F. The NMDAR1 receptor is not localized to the PSCs. NMDAR1 (red) shows no overlap with the PSCs, which are labeled with YOYO-1 (green). (N=2, n=40). G. NMDAR1 is not localized to the motor nerve terminal, which has been back-loaded with Alexa 595 Dextran (red). The DAPI (blue) indicates PSC nuclei. The arrows mark clusters of NMDAR1 receptors that are in the end-plate of the muscle. (N=4, n=31). Calibration bars, 10 μm.
Figure 6
Figure 6. Western Blots - mGluR2/3, GCPII (FOLH1), mGluR2, mGluR3, NMDAR1
A. Western blots of membranes from lizard brain. (i) Blot was probed with anti mGluR2 antibody (Santa Cruz); (ii) Blot was probed with anti mGluR3 antibody (Santa Cruz). (iii) Blot was probed with anti NMDAR1 antibody (Abcam). B. Western blot analysis of GCPII. Blot was probed with anti FOLH1 antibody (Aviva). From left to right, the lanes contained: lizard muscle, mouse brain, CHO cells transfected with GCPIII, CHO cells transfected with GCPII. C. Western blot analysis for presence of type II metabotropic glutamate receptors. Blot was probed with anti mGluR 2/3 (Santa Cruz). From left to right, the lanes contained: lizard muscle, CHO cells transfected with GCPII, mouse brain.
Figure 7
Figure 7. NAAG presynaptically inhibits the release of acetylcholine
A. Time course of EPP amplitude recorded from a single muscle cell. Each point represents the amplitude of the EPP response to a supramaximal stimulus to the motor nerve at 0.2 Hz. NAAG (100 μM) and NAAG peptidase inhibitor ZJ-43 (20 μM) were applied to the bathing solution during the time indicated by the horizontal bar. Averages of 15 traces, taken at three different times (as indicated by the boxes) are shown in the inset. Calibration bars, 1 mV, 5 ms. B. Mean EPP amplitudes are presented before (baseline), during (NAAG), and after (wash) the application of NAAG (100 μM) and ZJ-43 (20 μM). Asterisks indicate the means are significantly different from Baseline. * P=0.024, **P=0.0025. C. Mean EPP amplitudes before (baseline) and during application of one of the following drug treatments (drug): 20 μM ZJ-43 by itself (ZJ, n=11), ZJ-43 with 1 μM glutamate (Glu, n=16), and ZJ-43 with a combination of 100 μM NAAG and 10 μM group II mGluR antagonist LY341495 (NAAG+LY, n=39). None of these drug treatments were significantly different from baseline. D. Mean MEPP amplitude and frequency are shown as percent of baseline during (NAAG) and after (wash) application of 100 μM NAAG and 20 μM ZJ-43. Asterisks (**) indicate the mean is significantly different from baseline (P=0.026, N=4, paired t-test).

Similar articles

Cited by

References

    1. Arun P, Madhavarao CN, Moffett JR, Namboodiri MAA. Regulation of N-acetylaspartate and N-acetylaspartylglutamate biosynthesis by protein kinase activators. J Neurochem. 2006;98:2034–2042. - PubMed
    1. Becker I, Lodder J, Gieselmann V, Eckhardt M. Molecular characterization of N-acetylaspartylglutamate synthetase. J Biol Chem. 2010;285:29156–29164. - PMC - PubMed
    1. Berger UV, Carter RE, Coyle JT. The immunocytochemical localization of N-acetylaspartyl glutamate, its hydrolysing enzyme NAALADase, and the NMDAR-1 receptor at a vertebrate neuromuscular junction. Neuroscience. 1995;64:847–850. - PubMed
    1. Berger UV, Carter RE, McKee M, Coyle JT. N-acetylated alpha-linked acidic dipeptidase is expressed by non-myelinating Schwann cells in the peripheral nervous system. J Neurocytol. 1995;24:99–109. - PubMed
    1. Berger UV, Luthi-Carter R, Passani LA, Elkabes S, Black I, Konradi C, Coyle JT. Glutamate carboxypeptidase II is expressed by astrocytes in the adult rat nervous system. J Comp Neurol. 1999;415:52–64. - PubMed

Publication types

MeSH terms