. 2012 Nov 7;4(1):28.
doi: 10.1186/1758-2946-4-28.

Effects of multiple conformers per compound upon 3-D similarity search and bioassay data analysis

Affiliations

Effects of multiple conformers per compound upon 3-D similarity search and bioassay data analysis

Sunghwan Kim et al. J Cheminform. .

Abstract

Background: To improve the utility of PubChem, a public repository containing biological activities of small molecules, the PubChem3D project adds computationally-derived three-dimensional (3-D) descriptions to the small-molecule records contained in the PubChem Compound database and provides various search and analysis tools that exploit 3-D molecular similarity. Therefore, the efficient use of PubChem3D resources requires an understanding of the statistical and biological meaning of computed 3-D molecular similarity scores between molecules.

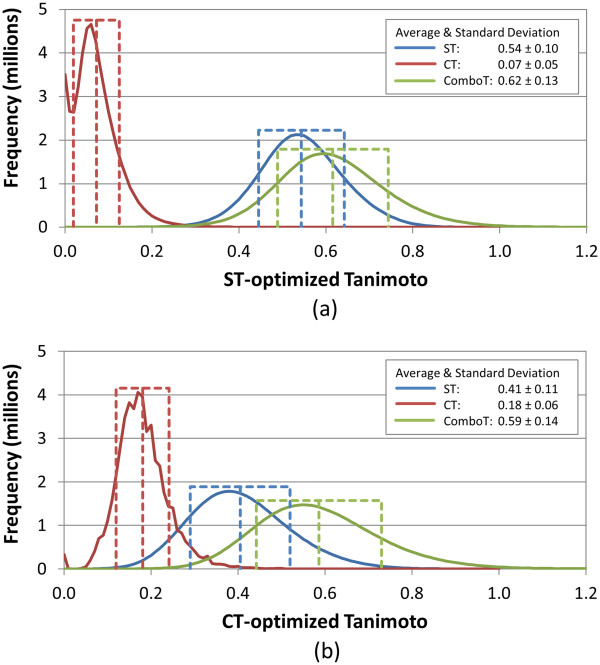
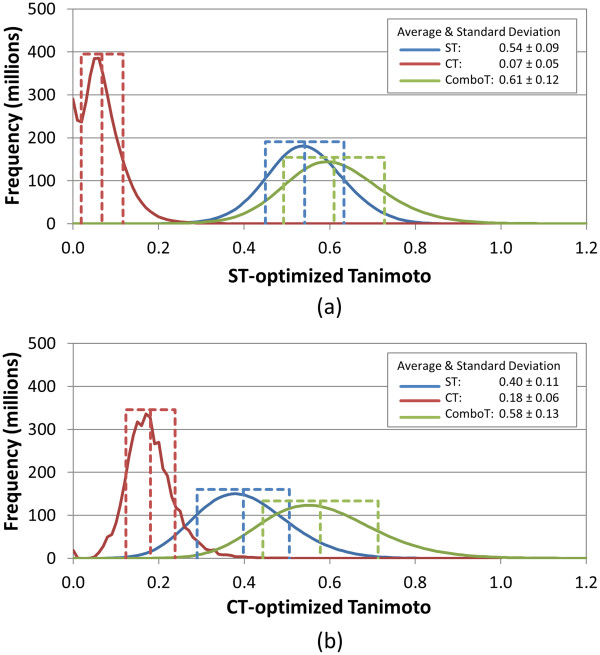
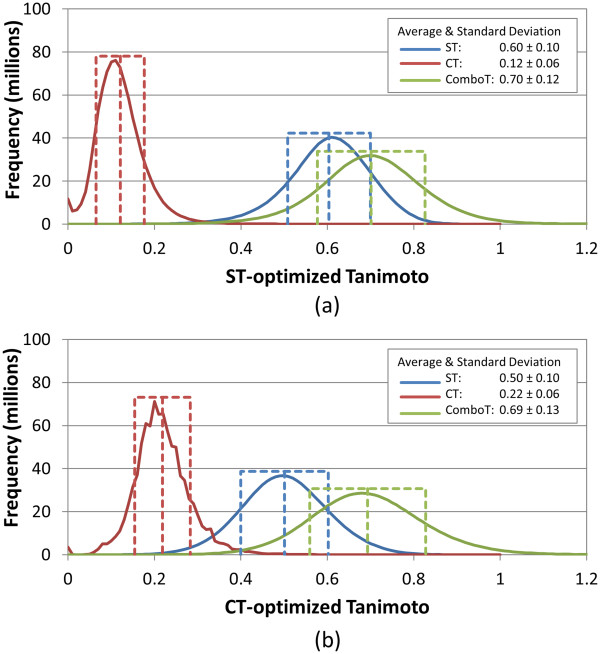
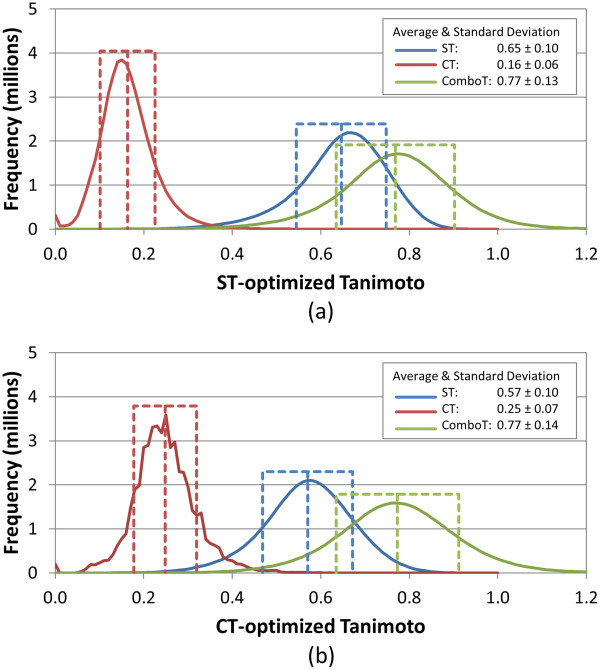
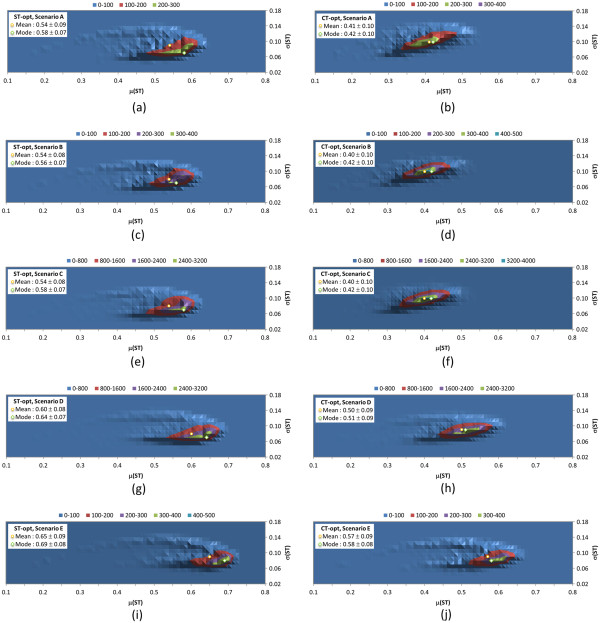
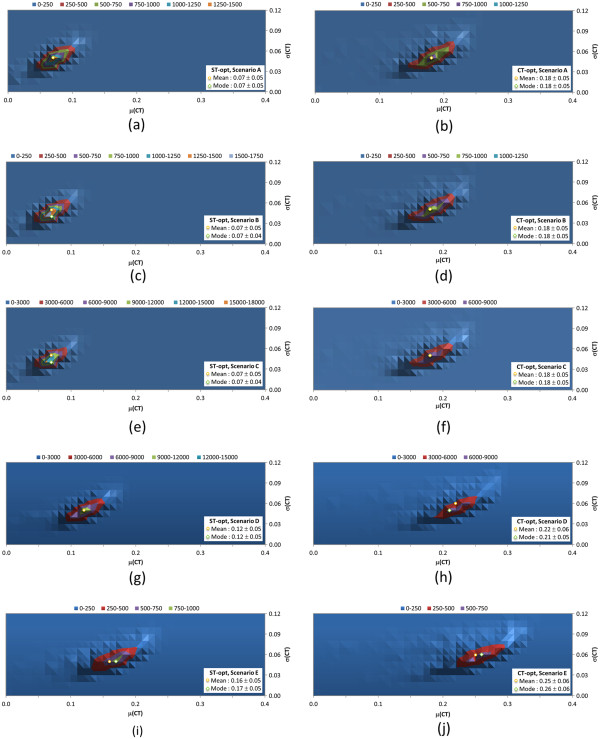
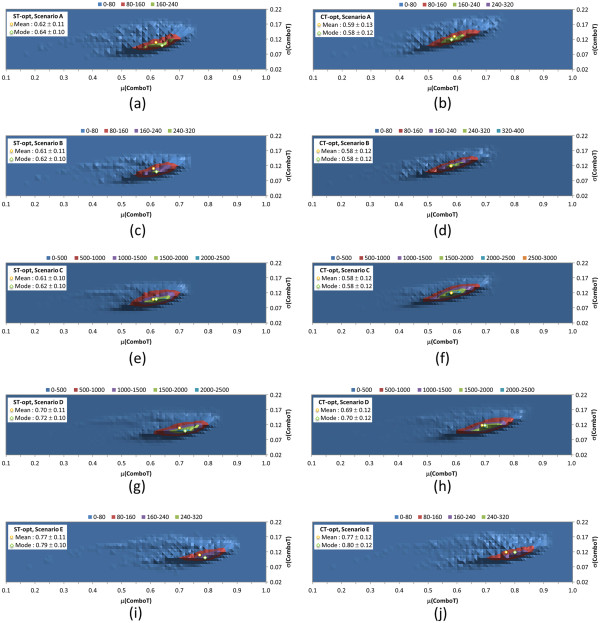
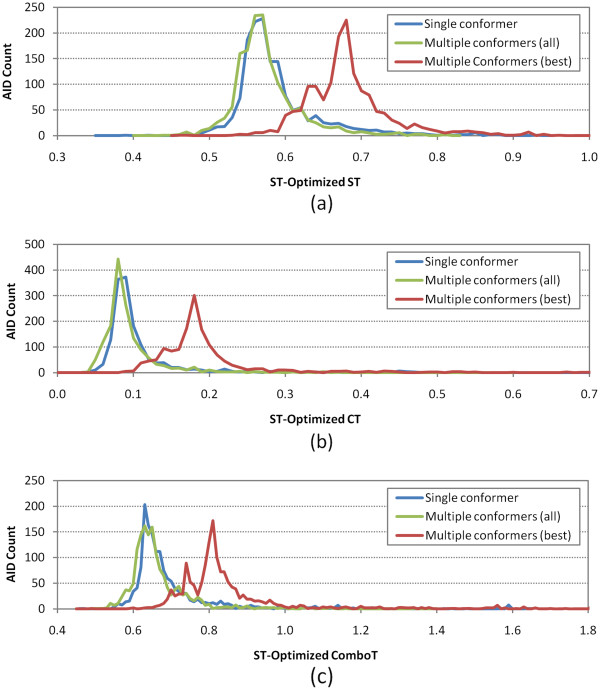
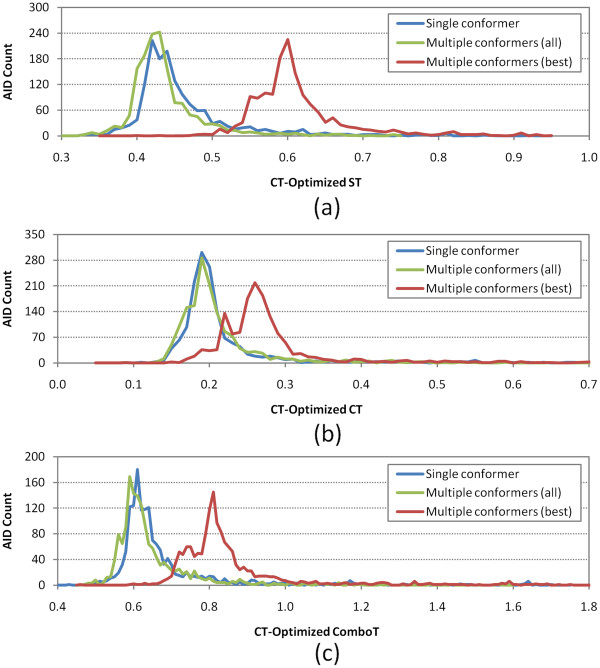
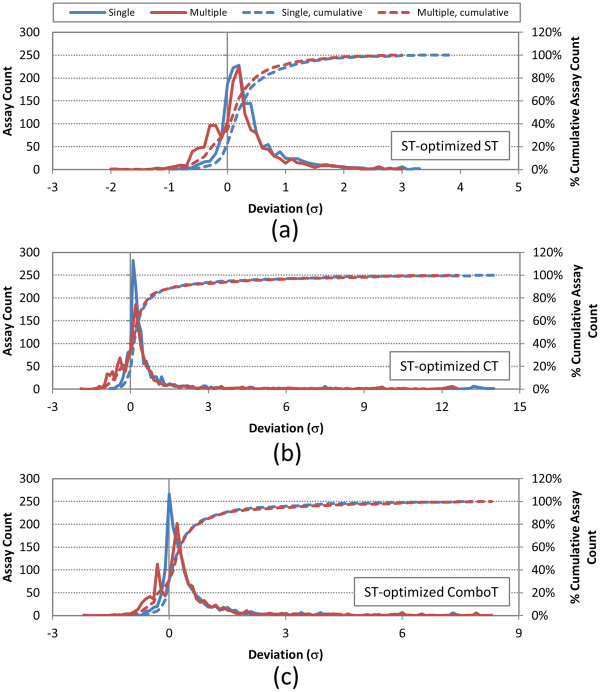
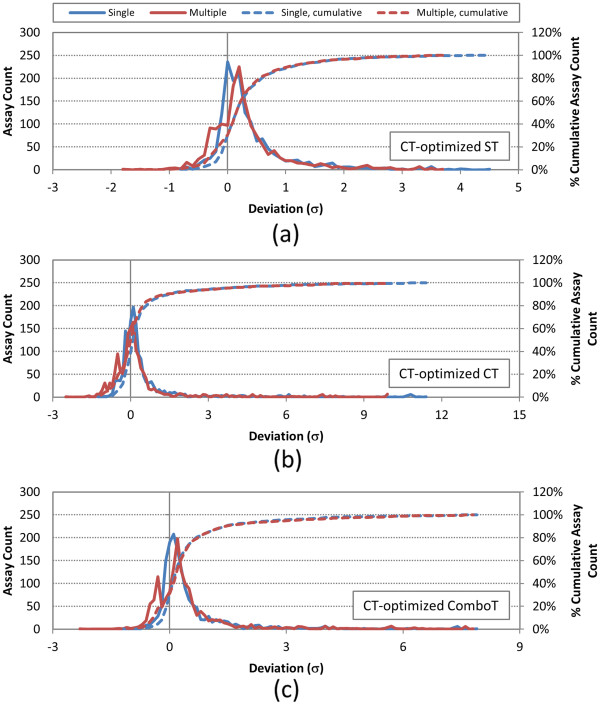
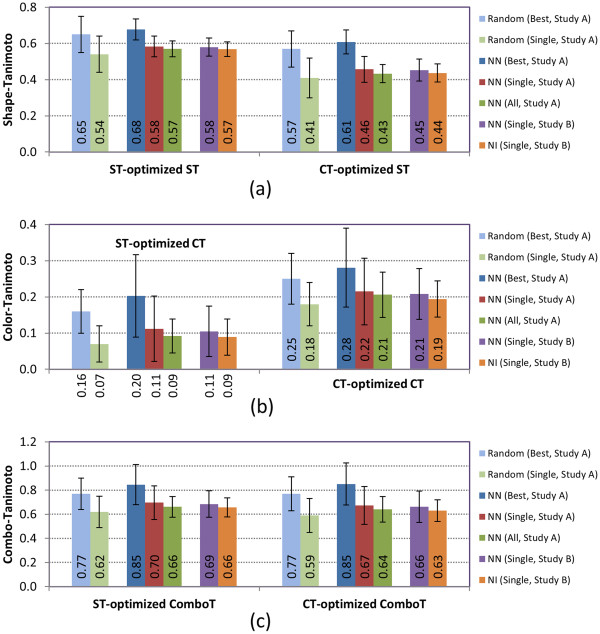
Results: The present study investigated effects of employing multiple conformers per compound upon the 3-D similarity scores between ten thousand randomly selected biologically-tested compounds (10-K set) and between non-inactive compounds in a given biological assay (156-K set). When the "best-conformer-pair" approach, in which a 3-D similarity score between two compounds is represented by the greatest similarity score among all possible conformer pairs arising from a compound pair, was employed with ten diverse conformers per compound, the average 3-D similarity scores for the 10-K set increased by 0.11, 0.09, 0.15, 0.16, 0.07, and 0.18 for STST-opt, CTST-opt, ComboTST-opt, STCT-opt, CTCT-opt, and ComboTCT-opt, respectively, relative to the corresponding averages computed using a single conformer per compound. Interestingly, the best-conformer-pair approach also increased the average 3-D similarity scores for the non-inactive-non-inactive (NN) pairs for a given assay, by comparable amounts to those for the random compound pairs, although some assays showed a pronounced increase in the per-assay NN-pair 3-D similarity scores, compared to the average increase for the random compound pairs.

Conclusion: These results suggest that the use of ten diverse conformers per compound in PubChem bioassay data analysis using 3-D molecular similarity is not expected to increase the separation of non-inactive from random and inactive spaces "on average", although some assays show a noticeable separation between the non-inactive and random spaces when multiple conformers are used for each compound. The present study is a critical next step to understand effects of conformational diversity of the molecules upon the 3-D molecular similarity and its application to biological activity data analysis in PubChem. The results of this study may be helpful to build search and analysis tools that exploit 3-D molecular similarity between compounds archived in PubChem and other molecular libraries in a more efficient way.


Figures

Figure 1
Figure 1
Similarity distributions for “single-conformer” (Scenario A) approach. Binned distributions in 0.01 increments of the 3-D similarity scores for the unique “conformer-conformer” pairs arising from 10,000 randomly selected biologically tested compounds (10-K set), computed using a single conformer per compound for (a) ST-optimized and (b) CT-optimized superpositions.
Figure 2
Figure 2
Similarity distributions for multi-conformer “all-conformer-pair” (Scenario B) approach. Binned distributions in 0.01 increments of the 3-D similarity scores for the unique “conformer-conformer” pairs arising from 10,000 randomly selected biologically tested compounds (10-K set), computed using ten diverse conformers per compound and the “all-conformer-pair” approach for (a) ST-optimized and (b) CT-optimized superpositions.
Figure 3
Figure 3
Similarity distributions for multi-conformer “best-conformer-pair” (Scenario D) approach. Binned distributions in 0.01 increments of the 3-D similarity scores for the unique “conformer-compound” pairs arising from 10,000 randomly selected biologically tested compounds (10-K set), computed using ten diverse conformers per compound and the “best-conformer-pair” approach for (a) ST-optimized and (b) CT-optimized superpositions.
Figure 4
Figure 4
Similarity distributions for multi-conformer “best-conformer-pair” (Scenario E) approach. Binned distributions in 0.01 increments of the 3-D similarity scores for the unique “compound-compound” pairs arising from 10,000 randomly selected biologically tested compounds (10-K set), computed using ten diverse conformers per compound and the “best-conformer-pair” approach for (a) ST-optimized and (b) CT-optimized superpositions.
Figure 5
Figure 5
Average and standard deviation distributions for shape-Tanimoto (ST), per “query”. Binned distributions in 0.01 increments of the average and standard deviation of the shape-Tanimoto (ST) scores per query-type for the five similarity search scenarios tested (see Table 1): Scenario A [(a) and (b)], Scenario B [(c) and (d)], Scenario C [(e) and (f)], Scenario D [(g) and (h)], and Scenario E [(i) and (j)]. The left panels [(a), (c), (e), (g), and (i)] are for the ST-optimized ST scores, and the right panels [(b), (d), (f), (h), and (j)] are for the CT-optimized ST scores.
Figure 6
Figure 6
Average and standard deviation distributions for color-Tanimoto (CT), per “query”. Binned distributions in 0.01 increments of the average and standard deviation of the color-Tanimoto (CT) scores per query-type for the five similarity search scenarios tested (see Table 1): Scenario A [(a) and (b)], Scenario B [(c) and (d)], Scenario C [(e) and (f)], Scenario D [(g) and (h)], and Scenario E [(i) and (j)]. The left panels [(a), (c), (e), (g), and (i)] are for the ST-optimized CT scores, and the right panels [(b), (d), (f), (h), and (j)] are for the CT-optimized CT scores.
Figure 7
Figure 7
Average and standard deviation distributions for combo-Tanimoto (ComboT), per “query”. Binned distributions in 0.01 increments of the average and standard deviation of the combo-Tanimoto (ComboT) scores per query-type for the five similarity search scenarios tested (see Table 1): Scenario A [(a) and (b)], Scenario B [(c) and (d)], Scenario C [(e) and (f)], Scenario D [(g) and (h)], and Scenario E [(i) and (j)]. The left panels [(a), (c), (e), (g), and (i)] are for the ST-optimized ComboT scores, and the right panels [(b), (d), (f), (h), and (j)] are for the CT-optimized ComboT scores.
Figure 8
Figure 8
Break down of assays by type. Assay-type counts for the 1,528 bioassays considered in the present study.
Figure 9
Figure 9
Per-AID shape-Tanimoto (ST)-optimized 3-D similarity average values. Binned distributions in 0.01 increments of the average 3-D similarity scores for non-inactive–non-inactive (NN) pairs of 1,528 AIDs in the PubChem BioAssay database, computed at the shape-Tanimoto-optimized superposition: (a) shape-Tanimoto (ST), (b) color-Tanimoto (CT), and (c) combo-Tanimoto (ComboT). “Single conformer”, “Multiple conformers (all)”, and “Multiple conformers (best)” correspond to search scenarios A, B, and E, respectively (See Table 1).
Figure 10
Figure 10
Per-AID color-Tanimoto (CT)-optimized 3-D similarity average values. Binned distributions in 0.01 increments of the average 3-D similarity scores for non-inactive–non-inactive (NN) pairs of 1,528 AIDs in the PubChem BioAssay database, computed at color-Tanimoto-optimized superposition: (a) shape-Tanimoto (ST), (b) color-Tanimoto (CT), and (c) combo-Tanimoto (ComboT). “Single conformer”, “Multiple conformers (all)”, and “Multiple conformers (best)” correspond to search scenarios A, B, and E, respectively (See Table 1).
Figure 11
Figure 11
Deviation from random of per-AID shape-Tanimoto (ST)-optimized 3-D similarity average values. Deviation of the ST-optimized 3-D similarity scores for non-inactive–non-inactive (NN) pairs of 1,528 AIDs from the corresponding average for the random compound pairs, computed using both a single conformer and best multiple (ten) diverse conformers per compound: (a) ST-optimized ST, (b) ST-optimized CT, and (c) ST-optimized ComboT. The deviations are binned with increment of 0.1 standard deviation (σ) unit. “Single” and “Multiple” refer to search scenarios A and E, respectively (See Table 1).
Figure 12
Figure 12
Deviation from random of per-AID color-Tanimoto (CT)-optimized 3-D similarity average values. Deviation of the CT-optimized 3-D similarity scores for non-inactive–non-inactive (NN) pairs of 1,528 AIDs from the corresponding average for the random compound pairs, computed using both a single conformer and best multiple (ten) diverse conformers per compound: (a) CT-optimized ST, (b) CT-optimized CT, and (c) CT-optimized ComboT. The deviations are binned with increment of 0.1 standard deviation (σ) unit. “Single” and “Multiple” refer to search scenarios A and E, respectively (See Table 1).
Figure 13
Figure 13
Demonstrated multi-conformer effects using AID 1033. Effects of employing multiple conformers per compound upon 3-D similarity of the non-inactive compounds tested in AID 1033. Eight compounds in panel (a) are non-inactive in AID 1033. Panel (b) depicts the dendrogram that shows the 2-D similarity among the eight structures, computed using the PubChem subgraph fingerprints. The dendrograms for the 3-D shape-optimized combo-Tanimoto (ComboTST-opt) similarity are shown in panels (c) and (d) for a single conformer per compound and ten diverse conformers per compound, respectively. Panel (e) compares conformer superpositions between two of the non-inactive compounds (CIDs 668798 and 1246750). LID stands for the local identifier, which represents different conformers of a compound.
Figure 14
Figure 14
Demonstrated multi-conformer effects using AID 491. Effects of employing multiple conformers per compound upon 3-D similarity of non-inactive compounds tested in AID 491. Panel (a) shows the dendrogram based on 2-D similarity among eight compounds selected from 60 non-inactive compounds in AID 491. The dendrograms for the 3-D shape-optimized combo-Tanimoto (ComboTST-opt) similarity are shown in panels (b) and (c) for a single conformer per compound and ten diverse conformers per compound, respectively. Panel (d) compares conformer superpositions between two of the non-inactive compounds (CIDs 490518 and 505938). LID stands for the local conformer identifier, which represents different conformers of a compound.
Figure 15
Figure 15
Summary comparison of overall average similarity. Comparison of the overall average 3-D similarity scores, μμ(XT)], for the non-inactive–non-inactive (NN) pairs with those for the non-inactive–inactive (NI) pairs and random compound pairs. The words, “Single”, “Best”, and “All”, in the legend box indicate the single-conformer approach (Scenario A), “best-conformer-pair” approach (Scenario E), and “all-conformer-pair” approach (Scenario B), respectively. Study A is the present study, and Study B is a previous study by Kim et al. (Ref. [10]).

Similar articles

Cited by

References

    1. Bolton EE, Wang Y, Thiessen PA, Bryant SH. In: Annual Reports in Computational Chemistry. Volume 4. Ralph AW, David CS, editor. Amsterdam, the Netherlands: Elsevier; 2008. PubChem: integrated platform of small molecules and biological activities; pp. 217–241.
    1. Wang YL, Bolton E, Dracheva S, Karapetyan K, Shoemaker BA, Suzek TO, Wang JY, Xiao JW, Zhang J, Bryant SH. An overview of the PubChem BioAssay resource. Nucleic Acids Res. 2010;38:D255–D266. doi: 10.1093/nar/gkp965. - DOI - PMC - PubMed
    1. Wang YL, Xiao JW, Suzek TO, Zhang J, Wang JY, Zhou ZG, Han LY, Karapetyan K, Dracheva S, Shoemaker BA. et al.PubChem's BioAssay Database. Nucleic Acids Res. 2012;40:D400–D412. doi: 10.1093/nar/gkr1132. - DOI - PMC - PubMed
    1. Sayers EW, Barrett T, Benson DA, Bolton E, Bryant SH, Canese K, Chetvernin V, Church DM, DiCuccio M, Federhen S. et al.Database resources of the National Center for Biotechnology Information. Nucleic Acids Res. 2012;40:D13–D25. doi: 10.1093/nar/gkr1184. - DOI - PMC - PubMed
    1. PubChem3D Thematic Series. http://www.jcheminf.com/series/pubchem3d.

LinkOut - more resources