. 2012 Nov 7:11:369.
doi: 10.1186/1475-2875-11-369.

ATP and luciferase assays to determine the rate of drug action in in vitro cultures of Plasmodium falciparum

Affiliations

ATP and luciferase assays to determine the rate of drug action in in vitro cultures of Plasmodium falciparum

Tasmiyah Khan et al. Malar J. .

Abstract

Background: Knowledge of the rate of action of compounds against cultured malaria parasites is required to determine the optimal time-points for drug mode of action studies, as well as to predict likely in vivo parasite clearance rates in order to select optimal hit compounds for further development. In this study, changes in parasite ATP levels and transgenic luciferase reporter activity were explored as means to detect drug-induced stress in cultured parasites.

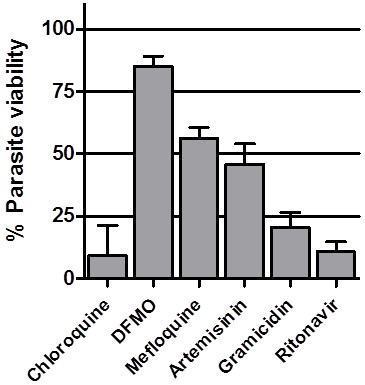
Methods: In vitro cultures of Plasmodium falciparum 3D7 wild-type or firefly luciferase-expressing parasites were incubated with a panel of six anti-malarial compounds for 10 hours and parasite ATP levels or luciferase activity determined at two-hour intervals using luminescence-based reagents. For comparative purposes, parasite morphology changes were evaluated by light microscopy, as well as the extent to which parasites recover after 48 hours from a six-hour drug treatment using a parasite lactate dehydrogenase assay.

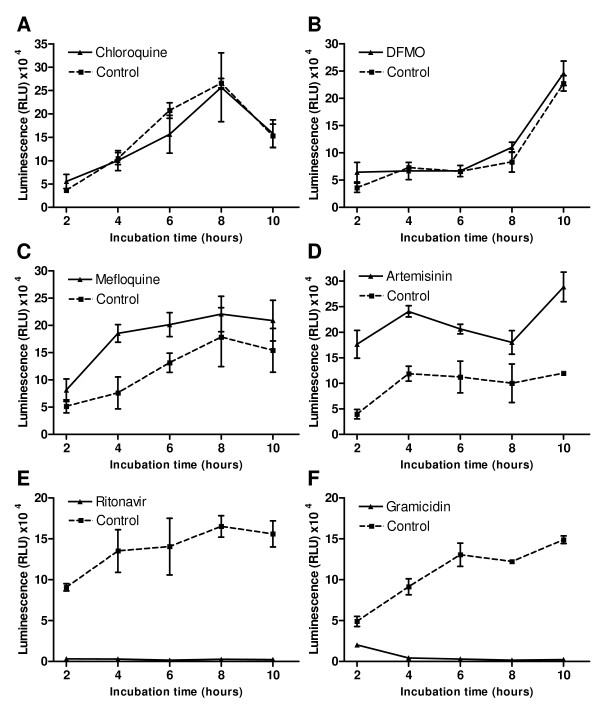
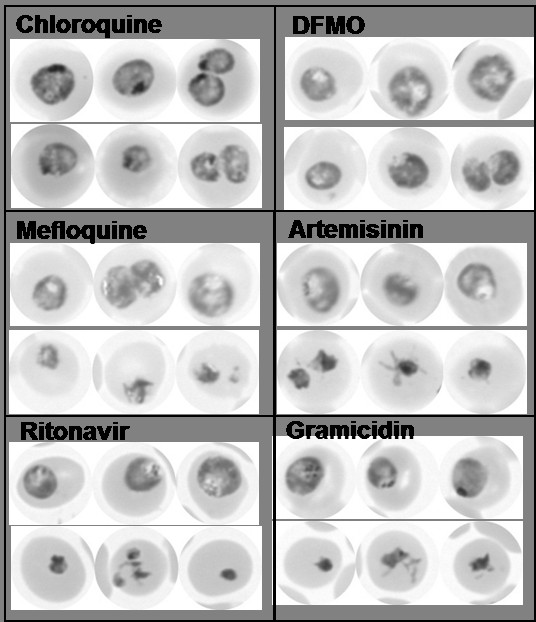
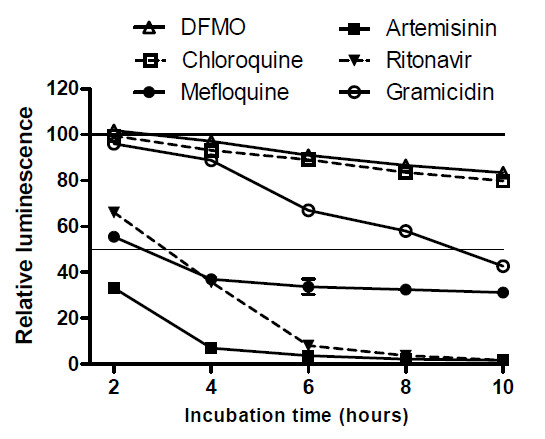
Results: Changes in parasite ATP levels displayed three phenotypes: mild or no change (chloroquine, DFMO); 2-4 fold increase (mefloquine, artemisinin); severe depletion (ritonavir, gramicidin). The respective phenotypes and the rate at which they manifested correlated closely with the extent to which parasites recovered from a six-hour drug treatment (with the exception of chloroquine) and the appearance and severity of morphological changes observed by light microscopy. Luciferase activity decreased profoundly in parasites treated with mefloquine, artemisinin and ritonavir (34-67% decrease in 2 hours), while chloroquine and DFMO produced only mild changes over 10 hours. Gramicidin yielded intermediate decreases in luciferase activity.

Conclusions: ATP levels and luciferase activity respond rapidly to incubation with anti-malarial drugs and provide quantitative read-outs to detect the appearance and magnitude of drug-induced stress in cultured parasites. The correlation between the observed changes and irreversible parasite toxicity is not yet sufficiently clear to predict clinical clearance rates, but may be useful for ranking compounds against each other and standard drugs vis-à-vis rate of action and for determining early time-points for drug mode of action studies.


Figures

Figure 1
Figure 1
Variation in ATP levels in drug-treated parasites. Plasmodium falciparum 3D7 parasite cultures were incubated for 10 hours with 100 nM chloroquine (A), 10 mM DFMO (B), 100 nM mefloquine (C), 100 nM artemisinin (D), 100 μM ritonavir (E) or 0.1 nM gramicidin (F). At 2-hour intervals, aliquots were removed from drug exposed (solid line) and solvent control (dotted line) cultures, parasites were isolated by saponin lysis and centrifugation through a phthalate oil layer, and their ATP content determined with a luminescence based CellTitre-Glo® reagent (Promega). Individual data-points are mean luminescence values (relative light units – RLU) from three aliquots per culture processed in parallel and error bars indicate the standard deviation.
Figure 2
Figure 2
Parasite morphology after 6–8 hours of drug treatment. Plasmodium falciparum 3D7 parasite cultures were incubated for 8 hours with 100 nM chloroquine or 10 mM DFMO, or for 6 hours with 100 nM mefloquine, 100 nM artemisinin, 100 μM ritonavir or 0.1 nM gramicidin. Giemsa-stained thin blood smears were prepared from drug-exposed and solvent control cultures and viewed by bright-field light microscopy using a 100x oil-immersion objective. In each case, three representative images of control (upper row) and treated (lower row) parasites are shown.
Figure 3
Figure 3
Parasite recovery from a 6-hour drug exposure. Plasmodium falciparum 3D7 parasite cultures were incubated for 6 hours with 100 nM chloroquine, 10 mM DFMO, 100 nM mefloquine, 100 nM artemisinin, 100 μM ritonavir or 0.1 nM gramicidin. The infected erythrocytes were washed and returned to culture in drug-free medium for an additional 48 hours, after which pLDH activity was determined for each culture (solid bars). Percentage parasite viability was calculated from pLDH activity relative to solvent-treated controls after subtraction of background values obtained with uninfected control erythrocyte cultures. Each drug treatment was performed in three parallel cultures and the bars represent the mean percentage parasite viability values and the error bars standard deviation.
Figure 4
Figure 4
Variation in luciferase activity in drug-treated transgenic parasites. Plasmodium falciparum 3D7 parasites expressing firefly luciferase were incubated for 10 hours with chloroquine, DFMO , mefloquine, artemisinin , ritonavir or gramicidin in 96-well plates. At 2-hour intervals, luciferase activity in drug-exposed and solvent control cultures was determined with a luminescence based Bright-Glo® Luciferase Assay System reagent (Promega). At each time-point, luminescence is plotted as a percentage relative to that obtained with controls incubated with solvent alone, after background luminescence produced by uninfected red blood cells had been subtracted. Individual data-points are the mean relative luminescence values from three replicate wells and error bars indicate standard deviation.
Figure 5
Figure 5
Effect of proteasome inhibitors on mefloquine-induced luciferase activity decrease. Plasmodium falciparum 3D7 parasites expressing firefly luciferase were incubated for 6 hours with 100 nM mefloquine, 5 μM lactacystin or 300 nM MG-132, or with 100 nM mefloquine combined with lactacystin or MG-132 in a 96-well plate. Luciferase activity in drug-exposed (solid bars) and solvent control (shaded bars) cultures was determined with a luminescence based Bright-Glo® Luciferase Assay System reagent (Promega). Individual data-points are mean luminescence values (relative light units – RLU) from three replicate wells and error bars indicate standard deviation.

Similar articles

Cited by

References

    1. Burrows JN, Chibale K, Wells TNC. The state of the art in anti-malarial drug discovery and development. Curr Top Med Chem. 2011;11:1226–1254. doi: 10.2174/156802611795429194. - DOI - PubMed
    1. Guiguemde WA, Shelat AA, Garcia-Bustos JF, Diagana TT, Gamo FJ, Guy RK. Global phenotypic screening for antimalarials. Chem Biol. 2012;19:116–129. doi: 10.1016/j.chembiol.2012.01.004. - DOI - PMC - PubMed
    1. Dharia NV, Chatterjee A, Winzeler EA. Genomics and systems biology in malaria drug discovery. Curr Opin Investig Drugs. 2010;11:131–138. - PubMed
    1. Sanz LM, Crespo B, De-Cózar C, Ding XC, Llergo JL, Burrows JN, Garcia-Bustos JF, Gamo FJ. P.falciparum in vitro killing rates allow to discriminate between different antimalarial mode-of-action. PLoS One. 2012;7:e30949. doi: 10.1371/journal.pone.0030949. - DOI - PMC - PubMed
    1. Assaraf YG, Golenser J, Spira DT, Messer G, Bachrach U. Cytostatic effect of DL-α-difluoromethylornithine against Plasmodium falciparum and its reversal by diamines and spermidine. Parasitol Res. 1987;73:313–318. doi: 10.1007/BF00531084. - DOI - PubMed

Publication types

MeSH terms

LinkOut - more resources