. 2012 Nov 7;13(1):8.
doi: 10.1186/1467-4866-13-8.

Characterisation of dissolved organic compounds in hydrothermal fluids by stir bar sorptive extraction - gas chomatography - mass spectrometry. Case study: the Rainbow field (36°N, Mid-Atlantic Ridge)

Affiliations

Characterisation of dissolved organic compounds in hydrothermal fluids by stir bar sorptive extraction - gas chomatography - mass spectrometry. Case study: the Rainbow field (36°N, Mid-Atlantic Ridge)

Cecile Konn et al. Geochem Trans. .

Abstract

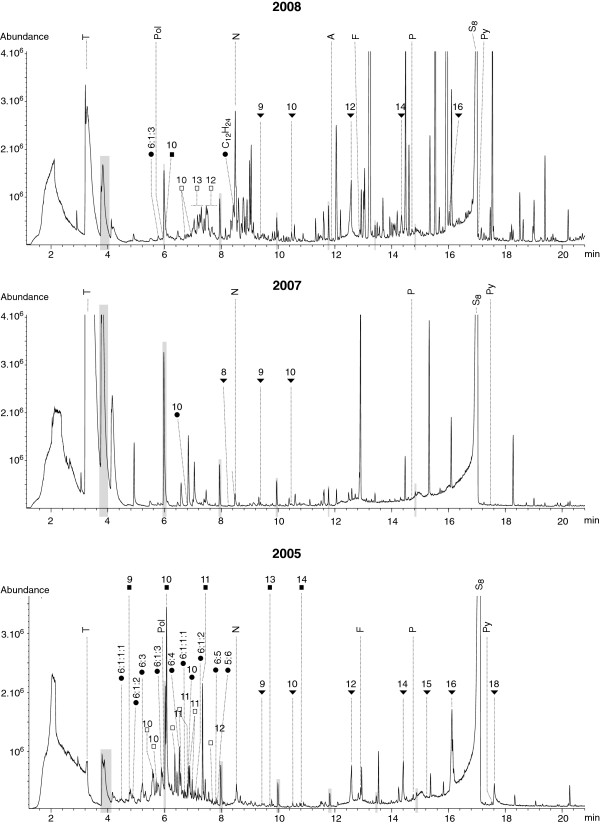
The analysis of the dissolved organic fraction of hydrothermal fluids has been considered a real challenge due to sampling difficulties, complexity of the matrix, numerous interferences and the assumed ppb concentration levels. The present study shows, in a qualitative approach, that Stir Bar Sorptive Extraction (SBSE) followed by Thermal Desorption - Gas Chromatography - Mass Spectrometry (TD-GC-MS) is suitable for extraction of small sample volumes and detection of a wide range of volatile and semivolatile organic compounds dissolved in hydrothermal fluids. In a case study, the technique was successfully applied to fluids from the Rainbow ultramafic-hosted hydrothermal field located at 36°14'N on the Mid-Atlantic Ridge (MAR). We show that n-alkanes, mono- and poly- aromatic hydrocarbons as well as fatty acids can be easily identified and their retention times determined. Our results demonstrate the excellent repeatability of the method as well as the possibility of storing stir bars for at least three years without significant changes in the composition of the recovered organic matter. A preliminary comparative investigation of the organic composition of the Rainbow fluids showed the great potential of the method to be used for assessing intrafield variations and carrying out time series studies. All together our results demonstrate that SBSE-TD-GC-MS analyses of hydrothermal fluids will make important contributions to the understanding of geochemical processes, geomicrobiological interactions and formation of mineral deposits.


Figures

Figure 1
Figure 1
Modified after Baltussen et al. [28]. Recovery as a function of the octanol-water partitioning constant log(Ko/w).
Figure 2
Figure 2
Left is a picture of a black smoker taken on the Rainbow field during the MoMARDREAM-Naut cruise in 2007 by the Nautile camera. Right is the bathymetric map of the Rainbow hydrothermal field: modified after Charlou et al. [16]. The map was established during the FLORES cruise, but the smokers were sampled again during the EXOMAR, MoMARDREAM-Naut and MOMAR08-Leg2 cruises. The box roughly marks the boundary of the active zone of the site, which can be described by 3 main active sub-areas: south-west (around A and B), central (Thermitière, dot) and north-east (around C). Sampling locations have been marked by crosses and have been referred in the text to A, B and C. The Twister® # that was used for extraction of the fluid sample stands next to each cross (to be related to Table  2).
Figure 3
Figure 3
Summary diagram of the SBSE procedure (A) and schematic representation of the sample preparation step (B).
Figure 4
Figure 4
Extracted ion chromatograms at the qualifier ions m/z 60 of the SBSE–TD-GC–MS analysis of 3 hydrothermal fluid samples (T10, T88, T92) and a deep seawater sample (T72). Top to bottom: T92, T10, T72 and T88. Description of these samples is found in Table  2. n-Carboxylic acids peaks are pointed out (full triangle) with their respective carbon number standing above. Rt are given in Table  3.
Figure 5
Figure 5
Extracted ion chromatograms at the qualifier ions m/z 57 (full line) and m/z 85 (dashed line) of the SBSE-TD-GC-MS of the 2005 hydrothermal fluid extract (Table2). n-Alkanes were only detected that year. The corresponding peaks are pointed out with their respective carbon number standing above. Rt are given in Table  4.
Figure 6
Figure 6
Zooms of extracted ion chromatograms at the qualifier ion m/z 104 (left) and m/z 91 (right) of the SBSE-TD-GC-MS analysis of 3 hydrothermal fluid samples (T10, T88, T92) and a deep seawater sample (T72). Arrows point out their respective traces. On the right panel, T92 and T10 signals are represented in dashed line while T72 and T88 appear in full line. The styrene peak elutes at 4.71 min (left) and the other BTEX in the 4.31 -4.71 min range (right). Refer to Table  2 and Table  5 for description of the samples and Rt values.
Figure 7
Figure 7
Zooms of extracted ion chromatograms at the qualifier ion m/z 91 of the SBSE-TD-GC-MS analysis of 3 hydrothermal fluid samples (T10, T88, T92) and a deep seawater sample (T72) (left panel); and 6 replicates of MQ water spiked with toluene at 10 μg/L (right panel). On the left panel, arrows point out the respective traces of natural samples. Refer to Table  2 and Table  5 for description of the samples and Rt values.
Figure 8
Figure 8
Extracted ion chromatograms at the qualifier ions m/z 154 (blue), m/z 166 (orange), m/z 178 (green), m/z 202 (purple) of the SBSE-TD-GC-MS analysis of 3 hydrothermal fluid samples (T10, T88, T92) and a deep seawater sample (T72). Qualifier ions correspond to the parent ions of PAHs that are pointed out on the chromatograms. Refer to Table  2 and Table  6 for description of the samples and Rt values.
Figure 9
Figure 9
Zoom of extracted ion chromatograms at the qualifier ion m/z 128 (naphthalene) of the SBSE-TD-GC-MS analysis of 3 hydrothermal fluid samples (T10, T88, T92) and a deep seawater sample (T72). Arrows point out each sample signal. See Table  2 and Table  6 for description of the samples and Rt values.
Figure 10
Figure 10
(A) is an overlay of TD-GC-MS TIC traces of SBSE extracts of 8 aliquots of the same fluid sample from the Rainbow hydrothermal vent field in 2008 (refer to Table2and Figure2). Offset of the traces was enabled for clarity. Seven stir bars, T91 to T97, were analysed on the same day; the last one, T98 (top trace) was analysed one day after. Peaks highlighted in grey are the Twister® characteristic peaks. The bottom trace was obtained for the dry blank experiment T100 (refer to § Sample collection and preparation and § Blank and control experiments) and is characteristic to a clean conditioned Twister® (2 h, 300°C, He 50 mL min-1). Note that the scale for the latter is different.
Figure 11
Figure 11
Representative TIC trace of the SBSE-TD-GC-MS analysis of 2000 m deep seawater in the neighbourhood of the Rainbow hydrothermal field. This particular sample was collected in 2007 at a depth of 2291 m. Major contaminants are: (a) toluene; (b) benzene; chloro-; (c) oxime, methoxyphenyl; (d) benzene, 1,x-dichloro; (e) octane, 1-chloro; (f) siloxane; (g) decane, 1-chloro; (h) naphthalene, 2-chloro; (i) siloxane; (k) diethylphthalate; (k’) phthalates. Peaks highlighted in grey are the Twister® characteristic peaks. Numbers stand for the carbonated chain lenght of n-alkanes (full squares) and n-carboxylic acids (full triangles). N is short for Naphthalene.
Figure 12
Figure 12
TIC traces obtained after TD-GC-MS analysis of Twisters® stirred in synthetic hydrothermal solutions.A: pH = 5.46, [Cl-] = 835 mM, [H2S] = 0.41 mM. B: pH = 3.13, [Cl-] = 305 mM. C: pH = 11.35, [Cl-] = 544 mM, [H2S] = 0.13 mM. D: pH = 11.86, [Cl-] = 5 mM, [H2S] = 3.3 mM. TICs were overlaid and are presented here with an offset for clarity.
Figure 13
Figure 13
TD-GC-MS TIC traces of SBSE extracts of 2 aliquots of the same fluid sample collected in 2005 from the Rainbow hydrothermal vent field. Duplicate experiments are routinely carried out and here is a representative example of what was generally observed. T11 (refer to Table  2) was analysed in 2005 (top trace), whereas T10 (refer to Table  2) was analysed 3 years later (bottom trace). Examples of peaks that were not repetable are: (a) toluene; (b) benzene, chloro-; (c) oxime, methoxyphenyl; (g) decane, 1-chloro; (h) naphthalene, 2-chloro; (i) siloxane; (k) diethylphthalate; (m) benzene sulfonylbis, [4-chloro]. Black triangles refer to n-carboxylic acids with the number being the carbonated chain length.
Figure 14
Figure 14
These two TD-GC-MS TIC traces are a representative choice of the results obtained after Twister® extraction of the fluids from the Rainbow hydrothermal vent field collected in 2007 in the south-west area B, T88 (refer to Table2) (top) and in the north-east area C, T78 (refer to Table2) (bottom). Examples of peaks that appeared in obvious different abundance are pointed out: (a) toluene; (b) benzene, chloro-; (c) oxime, methoxyphenyl; (e) octane, 1-chloro; (f) siloxane; (k) diethylphthalate; (k’) phthalatephthalates; (m) benzene sulfonylbis, [4-chloro].
Figure 15
Figure 15
These three TD-GC-MS TIC traces are a representative choice of the results obtained after Twister® extraction of the fluids from the Rainbow hydrothermal vent field in 2005 (bottom), 2007 (center) and 2008 (top). Numbers stand for the carbonated chain length of n-alkanes (full squares), branched alkanes (empty squares) and n-carboxylic acids (full triangles). Cycloalkanes (full circles) are distinguished by the number of carbon in the cycle (first figure) and the number of carbon of the side chain(s) (following figure(s)). T, Pol, N, A, P and Py, and are short for toluene, phenol, naphthalene, acenaphthene, phenanthrene, and pyrene. Cyclooctaatomic sulfur (S8) was pointed because the peak was major. Highlighted in grey is the characteristic Twister’s signature. Monoaromatic hydrocarbons appeared too small and were not pointed on the TICs for sake of clarity.

Similar articles

References

    1. Engel MH, Macko SA. Organic Geochemistry: Principles and Applications. Plenum Press, New York; 1993.
    1. Macleod G, McKeown C, Hall AJ, Russell MJ. Hydrothermal and oceanic pH conditions of possible relevance to the origin of life. Origins Life Evol. 1994;24(1):19–41. doi: 10.1007/BF01582037. - DOI - PubMed
    1. Russell MJ, Hall AJ, Boyce AJ, Fallick AE. 100th Anniversary Special Paper: On Hydrothermal Convection Systems and the Emergence of Life. Econ Geol. 2005;100(3):419–438.
    1. Simoneit BRT, Lein AY, Peresypkin VI, Osipov GA. Composition and origin of hydrothermal petroleum and associated lipids in the sulfide deposits of the Rainbow field (Mid-Atlantic Ridge at 36°N). Geochim. Cosmochim. Acta. 2004;68(10):2275. doi: 10.1016/j.gca.2003.11.025. - DOI
    1. Delacour A, Früh-Green GL, Bernasconi SM, Schaeffer P, Kelley DS. Carbon geochemistry of serpentinites in the Lost City Hydrothermal System (30°N, MAR) Geochim Cosmochim Acta. 2008;72(15):3681–3702. doi: 10.1016/j.gca.2008.04.039. - DOI

LinkOut - more resources