Controlled Clinical Trial
. 2013 Aug;62(8):1112-21.
doi: 10.1136/gutjnl-2012-303304. Epub 2012 Nov 7.

Insight into the prebiotic concept: lessons from an exploratory, double blind intervention study with inulin-type fructans in obese women

Affiliations
Controlled Clinical Trial

Insight into the prebiotic concept: lessons from an exploratory, double blind intervention study with inulin-type fructans in obese women

Evelyne M Dewulf et al. Gut. 2013 Aug.

Abstract

Objective: To highlight the contribution of the gut microbiota to the modulation of host metabolism by dietary inulin-type fructans (ITF prebiotics) in obese women.

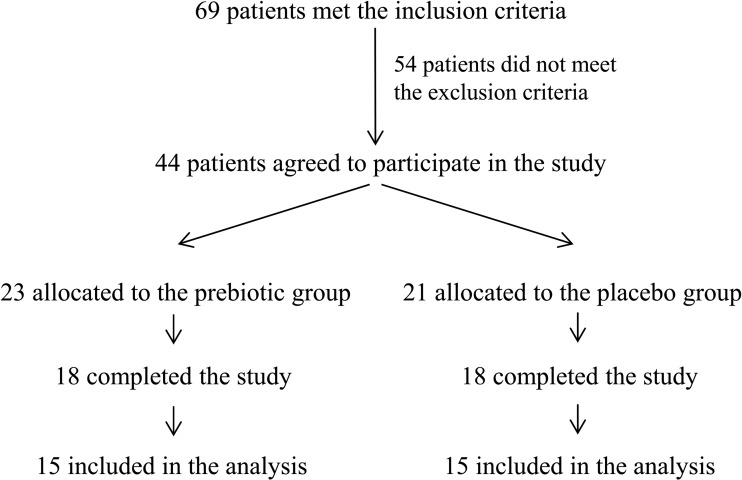
Methods: A double blind, placebo controlled, intervention study was performed with 30 obese women treated with ITF prebiotics (inulin/oligofructose 50/50 mix; n=15) or placebo (maltodextrin; n=15) for 3 months (16 g/day). Blood, faeces and urine sampling, oral glucose tolerance test, homeostasis model assessment and impedancemetry were performed before and after treatment. The gut microbial composition in faeces was analysed by phylogenetic microarray and qPCR analysis of 16S rDNA. Plasma and urine metabolic profiles were analysed by 1H-NMR spectroscopy.

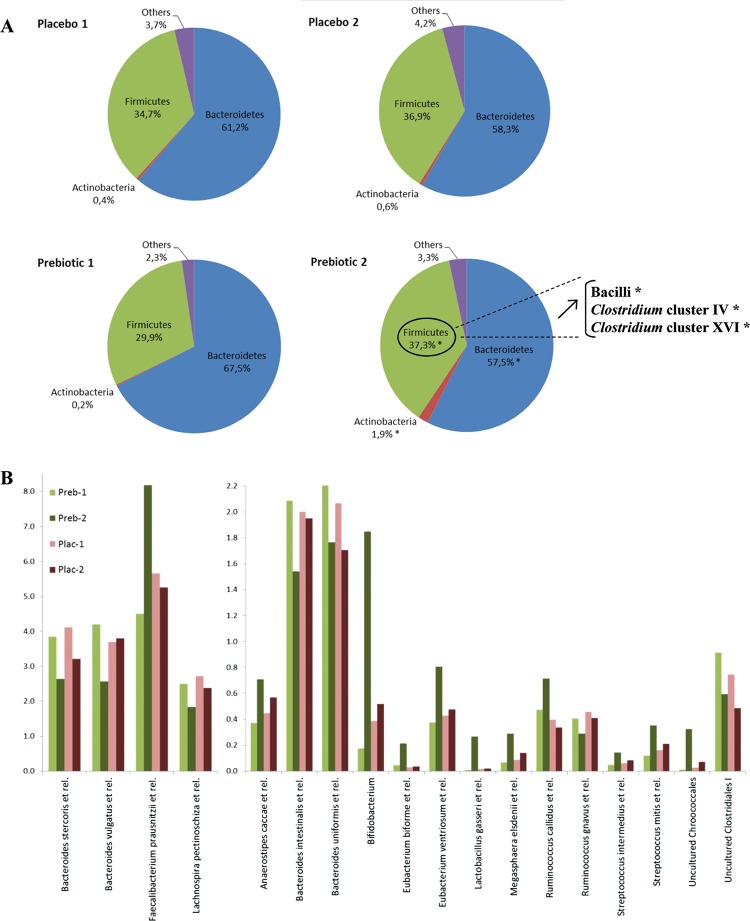
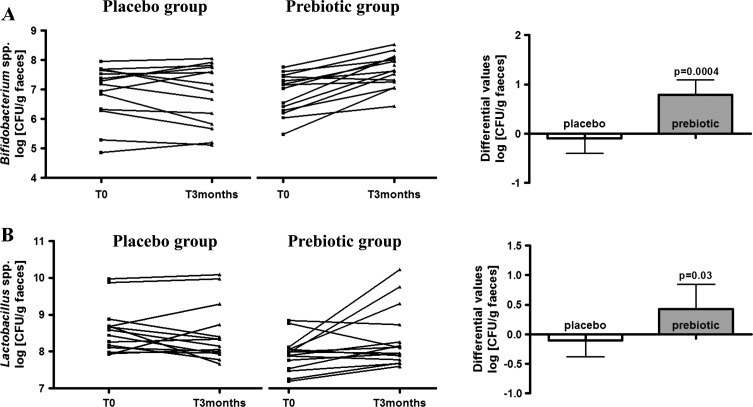
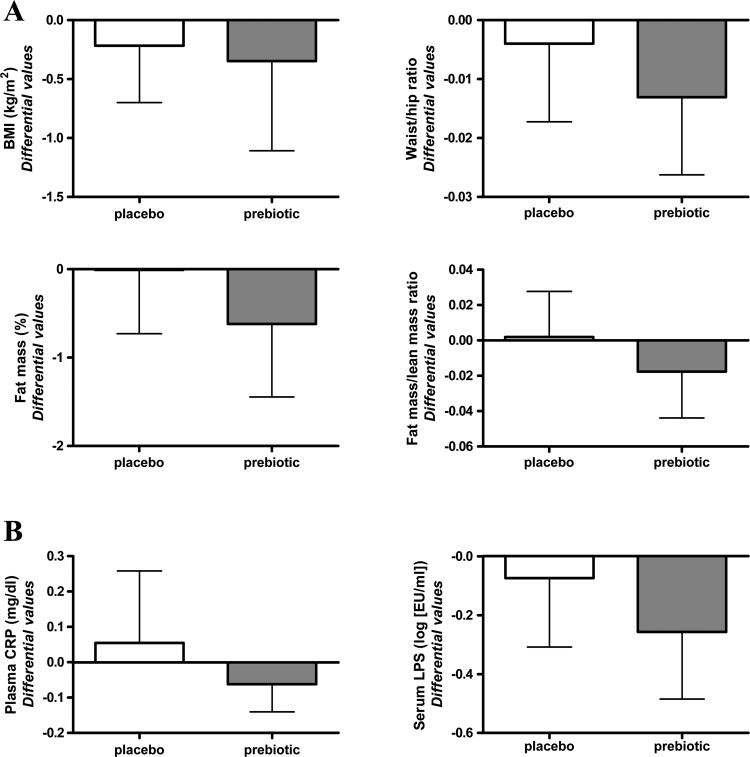
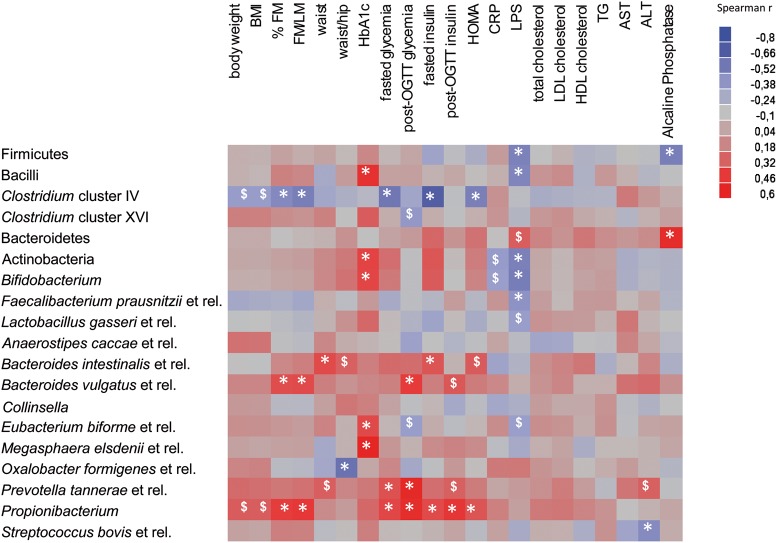
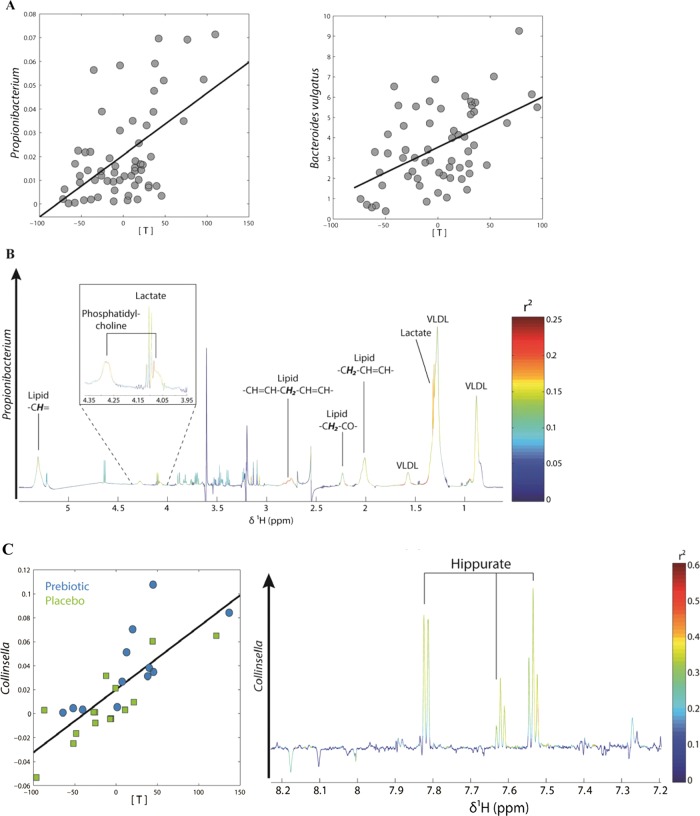
Results: Treatment with ITF prebiotics, but not the placebo, led to an increase in Bifidobacterium and Faecalibacterium prausnitzii; both bacteria negatively correlated with serum lipopolysaccharide levels. ITF prebiotics also decreased Bacteroides intestinalis, Bacteroides vulgatus and Propionibacterium, an effect associated with a slight decrease in fat mass and with plasma lactate and phosphatidylcholine levels. No clear treatment clustering could be detected for gut microbial analysis or plasma and urine metabolomic profile analyses. However, ITF prebiotics led to subtle changes in the gut microbiota that may importantly impact on several key metabolites implicated in obesity and/or diabetes.

Conclusions: ITF prebiotics selectively changed the gut microbiota composition in obese women, leading to modest changes in host metabolism, as suggested by the correlation between some bacterial species and metabolic endotoxaemia or metabolomic signatures.

Keywords: Intestinal Bacteria; Nutrition; Obesity; Prebiotic.


Figures

Figure 1
Figure 1
Trial profile. Of the 44 enrolled patients, eight patients failed to complete the study for the following reasons: pregnancy (one patient), loss of contact during follow-up (one patient), gastro-oesophageal reflux (two patients), personal reasons (two patients) and absence of weight loss (two patients). Of the 36 patients who completed the study, three patients per group were excluded from the analysis because of antibiotic treatment during the study and inadequate or missing faecal sampling.
Figure 2
Figure 2
Human Intestinal Tract Chip analysis. (A) Relative contribution (mean percentage of total detected bacteria at the phylum level) of the major phyla in both groups (placebo and treated): (1) before; and (2) after treatment. *p<0.05 according to the Wilcoxon signed rank test (T0 vs T3 months in the prebiotic group). Exact p values are given in online supplemental table S1. (B) Relative contribution (mean percentage of total detected bacteria at the genus-like taxonomic level) of the species/genus of bacteria in both groups before and after treatment (Preb-1: prebiotic group, T0; Preb-2: prebiotic group, T3 months; Plac-1: placebo group, T0; Plac-2: placebo group, T3 months).
Figure 3
Figure 3
Gut microbiota analysis by quantitative PCR. (A) Bifidobacterium spp.; (B) Lactobacillus spp. Left: individual levels in log (CFU/g faeces) for each patient of the placebo and prebiotic groups before (T0) and after (T3 months) treatment. Right: differential values (T3 months–T0) in log (CFU/g faeces). Results are given as mean±95% CI. p Values according the Mann-Whitney test (placebo vs prebiotic) to assess treatment effect.
Figure 4
Figure 4
(A) Anthropometric characteristics. (B) Plasma C-reactive protein (CRP) and serum lipopolysaccharide (LPS) of patients in both groups (placebo and treated) before (T0) and after (T3 months) treatment. Differential values (T3 months–T0) are given as mean±95% CI. Statistical analysis performed on transformed values (log) for LPS. BMI, body mass index.
Figure 5
Figure 5
Heat map of the Spearman r correlations between the gut bacteria significantly modified by the prebiotic treatment and anthropometric/biological parameters. Correlations were performed on differential values (T3 months–T0) for each patient in both groups (placebo and treated). *p<0.05; $p<0.1 following the Spearman correlation. ALT, alanine transaminase; AST, aspartate transaminase; BMI, body mass index; CRP, C-reactive protein; FM, fat mass; HDL, high-density lipoprotein; HOMA, homeostasis model assessment; LDL, low-density lipoprotein; LM, lean mass; LPS, lipopolysaccharides; OGTT, oral glucose tolerance test; TG, triglycerides.
Figure 6
Figure 6
(A) Partial least square (PLS) regression analysis between plasma metabolic profiles and gut levels of Propionibacterium and Bacteroides vulgatus: score plots showing the correlation between bacterial levels (relative contribution: y axis) and PLS scores (x axis). (B) PLS loading plot for Propionibacterium showing the contribution of plasma lactate and phosphatidylcholine to the model. (C) PLS regression analysis between changes in urinary metabolic profiles and changes in the gut levels of Collinsella performed on differential values (T3 months–T0). Left: PLS scores (x axis) are plotted against Collinsella levels (relative contribution: y axis). Right: PLS loading plot showing the contribution of hippurate to the model. Details of model parameters are described in the online supplemental methods section.

Comment in

References

    1. Hotamisligil GS. Inflammation and metabolic disorders. Nature 2006;444:860–7 - PubMed
    1. Delzenne NM, Cani PD. Interaction between obesity and the gut microbiota: relevance in nutrition. Annu Rev Nutr 2011;31:15–31 - PubMed
    1. Delzenne NM, Neyrinck AM, Cani PD. Modulation of the gut microbiota by nutrients with prebiotic properties: consequences for host health in the context of obesity and metabolic syndrome. Microb Cell Fact 2011;10(Suppl 1):S10. - PMC - PubMed
    1. Turnbaugh PJ, Ley RE, Mahowald MA, et al. An obesity-associated gut microbiome with increased capacity for energy harvest. Nature 2006;444:1027–31 - PubMed
    1. Turnbaugh PJ, Ridaura VK, Faith JJ, et al. The effect of diet on the human gut microbiome: a metagenomic analysis in humanized gnotobiotic mice. Sci Transl Med 2009;1:6ra14 - PMC - PubMed

Publication types

MeSH terms