

doi: 10.1128/JCM.02848-12.
Epub 2012 Nov 7.
Pathogenic potential of Bacillus cereus strains as revealed by phenotypic analysis
Affiliations
- PMID: 23135929
- PMCID: PMC3536244
- DOI: 10.1128/JCM.02848-12
Item in Clipboard
Pathogenic potential of Bacillus cereus strains as revealed by phenotypic analysis
J Clin Microbiol.
2013 Jan.
Abstract
The Bacillus cereus pathogenic spectrum ranges from strains used as probiotics to human-lethal strains. However, prediction of the pathogenic potential of a strain remains difficult. Here, we show that food poisoning and clinical strains can be differentiated from harmless strains on the basis of host colonization phenotypes.
Figures
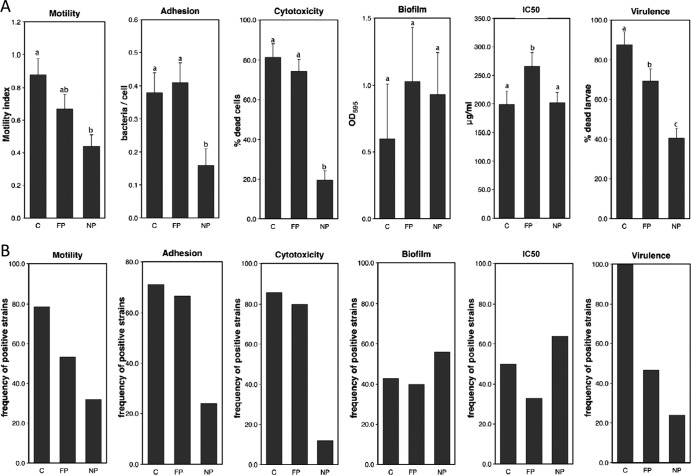
Phenotypic analyses of representative B. cereus strains. (A) Quantitative mean values ± standard deviations for motility, epithelial cell adhesion, cytotoxicity, biofilm formation, polymyxin B resistance, and virulence in the model insect G. mellonella for each group of strains. NP, nonpathogenic strains; FP, food poisoning strains; C, clinical strains. Bars with different letters (a, b, c) indicate significant differences in their mean values (P < 0.005). Results are the means of results of at least three independent experiments. (B) Frequencies of strains positive for each of the tested phenotypes in the various B. cereus groups. NP, nonpathogenic strains; FP, food poisoning strains; C, clinical strains. Frequencies were calculated relative to a threshold value defined for each phenotype as the median value for all strains.
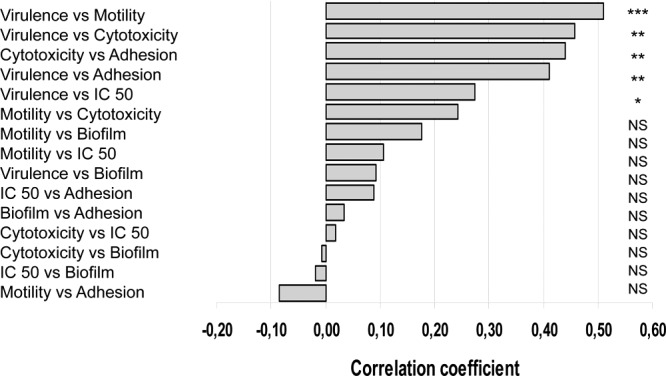
Pairwise correlation between the virulence phenotypes and statistical significance of the correlation coefficients. Each phenotype was compared to each of the others in pairwise tests, and correlation coefficients were determined for each pair of phenotypes. *, P < 0.05; **, P < 0.005; ***, P < 0.0001; NS, not significant.
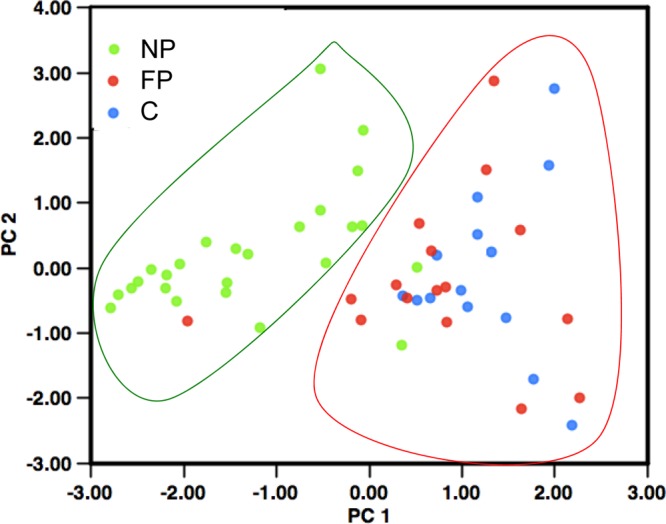
Principal component analysis. PC1 corresponds to a combination of adhesion, motility, cytotoxicity, and virulence in insects. PC2 corresponds to biofilm formation and motility. Each B. cereus strain was plotted according to its values in PC analysis. Green, red, and blue spots correspond to NP, FP, and C strains, respectively.
References
-
- Anonymous 2009. The community summary report on food-borne outbreaks in the European Union in 2007. EFSA J. doi:10.2903/j.efsa.2009.271r - DOI
-
- Stenfors Arnesen L, Fagerlund A, Granum P. 2008. From soil to gut: Bacillus cereus and its food poisoning toxins. FEMS Microbiol. Rev. 32:579–606 - PubMed
-
- Hong H, Duc Le H, Cutting S. 2005. The use of bacterial spore formers as probiotics. FEMS Microbiol. Rev. 29:813–835 - PubMed
Publication types
MeSH terms
Substances
LinkOut - more resources
Full Text Sources
Molecular Biology Databases
