. 2013 Feb;31(2):293-304.
doi: 10.1002/stem.1276.

Inhibition of T cell protein tyrosine phosphatase enhances interleukin-18-dependent hematopoietic stem cell expansion

Affiliations
Free PMC article

Inhibition of T cell protein tyrosine phosphatase enhances interleukin-18-dependent hematopoietic stem cell expansion

Annie Bourdeau et al. Stem Cells. 2013 Feb.
Free PMC article

Erratum in

  • Stem Cells. 2013 Jun;31(6):1224. Tremblayef, Michel L [corrected to Tremblay, Michel L]

Abstract

The clinical application of hematopoietic progenitor cell-based therapies for the treatment of hematological diseases is hindered by current protocols, which are cumbersome and have limited efficacy to augment the progenitor cell pool. We report that inhibition of T-cell protein tyrosine phosphatase (TC-PTP), an enzyme involved in the regulation of cytokine signaling, through gene knockout results in a ninefold increase in the number of hematopoietic progenitors in murine bone marrow (BM). This effect could be reproduced using a short (48 hours) treatment with a pharmacological inhibitor of TC-PTP in murine BM, as well as in human BM, peripheral blood, and cord blood. We also demonstrate that the ex vivo use of TC-PTP inhibitor only provides a temporary effect on stem cells and did not alter their capacity to reconstitute all hematopoietic components in vivo. We establish that one of the mechanisms whereby inhibition of TC-PTP mediates its effects involves the interleukin-18 (IL-18) signaling pathway, leading to increased production of IL-12 and interferon-gamma by progenitor cells. Together, our results reveal a previously unrecognized role for IL-18 in contributing to the augmentation of the stem cell pool and provide a novel and simple method to rapidly expand progenitor cells from a variety of sources using a pharmacological compound.


Figures

Figure 1
Figure 1
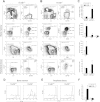
Increased numbers of bone marrow and peripheral blood progenitors in tc-ptp−/− mice. (A,B):tc-ptp+/+ (panel A) and tc-ptp−/− (panel B) BM or PB were stained for stem cells and hematopoietic progenitors and analyzed by flow cytometry. The frequency of each subpopulation is shown. First row: BM hematopoietic stem cells (HSCs) were identified as LinCD117+ and according to the expression of Sca-1 (low or high), and CD105. Second row: BM CMPs, GMPs, and MEPs were identified as LinCD127Sca-1CD117+ and according to the expression of CD34 and CD16/32. The results shown are gated on the LinCD127 subpopulation. Third row: BM CLPs were identified as LinCD127+ and according to the expression of Sca-1 and CD117. Fourth row: PB HSC were identified as LinCD117+ and according to the expression of Sca-1 (low or high) and CD105. (C): Absolute cell numbers ± SEM were derived from the relative cell numbers as determined by flow cytometry, and are shown for tc-ptp+/+ (white bars) and tc-ptp−/− (black bars) mice. BM subpopulations from tc-ptp+/+ (n = 3) and tc-ptp−/− (n = 3) mice were analyzed, and samples were read in duplicate; pooled samples of PB were obtained from tc-ptp+/+ (n = 3 pools of 2-3 mice) and tc-ptp−/− (n = 3 pools of 2-3 mice) animals. *, p < .0001 (D, E): BM was harvested from tc-ptp+/+ (n = 6) and tc-ptp−/− (n = 6) mice (panel D), and PB was harvested from tc-ptp+/+ (n = 6 pools of three mice) and tc-ptp−/− (n = 6 pools of three mice) animals (panel E); cells were labeled with CFDA and cultured for 2 days. Analysis was gated on LinSca-1+/hiCD117+CD105+. The number of cell divisions is indicated next to the corresponding CFDA peak. (F): The mitotic index for tc-ptp+/+ (white bars) and tc-ptp−/− (black bars) progenitors was calculated from flow cytometry data for BM and for PB, and is reported as mean ± SEM, *, p < .001. Abbreviations: BM, bone marrow; CFDA, carboxyfluorescein diacetate succinimidyl ester; CLP, common lymphoid progenitor; CMP, common myeloid progenitor; GMP, granulocyte monocyte progenitor; MEP, megakaryocyte erythrocyte progenitor; PB, peripheral blood.
Figure 2
Figure 2
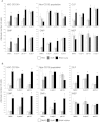
Treatment of murine bone marrow (BM) with TC-PTP inhibitors augments stem cell and progenitor subpopulations. (A): BALB/c, tc-ptp+/−, ptp1b−/−, and tc-ptp−/− BM cells were electroporated without RNAi (PBS; white bars), with a control scramble sequence (SCR; gray bars), or with a pool of TC-PTP RNAi (TC-PTP; black bars). The relative cell number for each BM cell subpopulation was obtained by flow cytometry after 72 hours, and the absolute cell counts ± SEM were calculated for HSC CD105+, non-CD105 subpopulation, CLP, GMP, CMP, and MEP. (B): BALB/c, tc-ptp+/−, and ptp1b−/− BM were treated with diluent only (DMSO; white bars), with 10 μM small molecule inhibitor (gray bars), or with 50 μM small molecule inhibitor (black bars). The relative cell number for each BM cell subpopulation was obtained by flow cytometry after 48 hours, and the absolute cell counts ± SEM were calculated for HSC CD105+, non-CD105 subpopulation, CLP, GMP, CMP, and MEP. BALB/c BM (n = 3); tc-ptp+/− BM (n = 3); ptp1b−/− BM (n = 3); tc-ptp−/− BM (n = 3). *, p < 0.05. Abbreviations: CLP, common lymphoid progenitor; CMP, common myeloid progenitor; DMSO, dimethyl sulfoxide; GMP, granulocyte monocyte progenitor; HSC, hematopoietic stem cell; MEP, megakaryocyte erythrocyte progenitor; PBS, phosphate buffered saline; SCR, scrambled RNAi sequence.
Figure 3
Figure 3
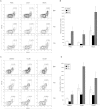
Treatment of human progenitor cells with TC-PTP inhibitors expands the stem cell pool. (A, B): Human BM (white bars), PB (black bars) or CB (gray bars) cells were electroporated without RNAi (PBS), with a control SCR, or with TC-PTP RNAi (TC-PTP). The relative cell number for LinCD34+CD133+ cells was obtained by flow cytometry after 72 hours, and the absolute cell count ± SEM was calculated (plots are gated on Lin cells). (C, D): Human BM (white bars), PB (black bars) or CB (gray bars) cells were treated with diluent only (DMSO), with 10 μM small molecule inhibitor, or with 50 μM small molecule inhibitor. The relative cell number for LinCD34+CD133+ cells was obtained by flow cytometry after 48 hours, and the absolute cell count ± SEM was calculated (plots are gated on Lin cells). BM (n = 3), PB (n = 3), and CB (n = 4). *, p < 0.05. Abbreviations: BM, bone marrow; CB, cord blood; DMSO, dimethyl sulfoxide; PB, peripheral blood; PBS, phosphate buffered saline; SCR, scrambled RNAi sequence.
Figure 4
Figure 4
Ex vivo inhibition of TC-PTP does not affect the ability of hematopoietic stem cell (HSC) to reconstitute host animals. Sorted bone marrow HSC CD105+GFP+ treated with dimethyl sulfoxide (control) or with TC-PTP inhibitor were injected via tail vein (100 or 1,000 stem cells per injection) into lethally irradiated BALB/c mice. Hematopoietic recovery was determined by analysis of peripheral blood samples at the indicated time points. The graphs are representative of five or six mice in each experimental group. (A): Peripheral blood absolute mononuclear cell counts per microliter were obtained by adding counting beads to the flow cytometry analysis. (B): The percentage of donor-derived cells were determined by number of GFP+ cells present in each blood sample. The absolute number of donor-derived GFP+ cells were determined also using flowset beads. Absolute cell count or percentage ± SEM was calculated. *, p < 0.01. Abbreviations: GFP, green fluorescent protein; TC-PTP, T-cell protein tyrosine phosphatase.
Figure 5
Figure 5
Increased cytokine signaling in tc-ptp−/− progenitors. Flow cytometry analysis of bone marrow (BM) hematopoietic stem cells from tc-ptp+/+ and tc-ptp−/− mice was performed to assess intracellular expression of (A) IL-18, (B) IL-18 binding protein (IL-18bp), or (C) phosphorylated Stat1 (p-Stat1) and total Stat1 protein. Analysis was gated on BM LinSca-1+/hiCD117+CD105+ cells. Staining of tc-ptp+/+ splenocytes was performed as positive control (A, B: third flow cytometry histogram). Nonspecific IgG was used as negative control (A, B, C: first flow cytometry histogram). The relative cell number is plotted against IgG, IL-18, IL-18bp, p-Stat1 or Stat1 fluorescence (thin line: tc-ptp+/+ BM or spleen; thick line: tc-ptp−/− BM). The MFI is indicated in the corresponding plot and presented in graphic format (white bars: tc-ptp+/+ BM, n = 4; black bars: tc-ptp−/− BM, n = 4; gray bars: tc-ptp+/+ spleen positive control, n = 2). Data are provided as MFI ± SEM. *, p < 0.05. Abbreviations: IL, interleukin; MFI, mean fluorescence intensity.
Figure 6
Figure 6
Inhibition of TC-PTP stimulates bone marrow (BM) hematopoietic stem cell expansion through the IL-18 signaling pathway. (A,B): BM was harvested from 7- to 10-week old BALB/c mice. Cells were cultured for 48 hours alone (BM WT; n = 3), or with 10 μg/mL IL-18 (BM WT + IL-18; n = 3), 50 μM TC-PTP inhibitor (BM WT + inhibitor; n = 3), or 50 μM inhibitor and IL-18 capture antibody (BM WT + inhibitor + IL-18 ab; n = 3). The experiment was repeated three times and each bar graph represents the average MFI obtained by flow cytometry analysis for each group. Data are provided as MFI ± SEM. *, p < .05 when compared to BM WT and **, p < .05 when compared to BM WT + IL-18 or BM WT + inhibitor. (A) Culture supernatants were compared by flow cytometry for relative content of IFN-γ, IL-12, and IL-18bp. (B) Combined surface and intracellular staining was used to assess intracellular IL-18bp and p-Stat1 expression in hematopoietic stem cells (LinSca-1+/hiCD117+CD105+). (C): BM from each experimental group was labeled with the cell tracer CFDA and cultured for 48 hours as described above. Hematopoietic stem cells (LinSca-1+/hiCD117+CD105+) were then analyzed by flow cytometry. Relative cell number is plotted against CFDA fluorescence. The number of cell divisions is indicated next to the corresponding CFDA peak and the mitotic index is provided. The flow cytometry CFDA plots shown are representative of three independent experiments each group was assessed in triplicate. Abbreviations: BM WT, wild-type bone marrow; CFDA, carboxyfluorescein diacetate succinimidyl ester; IFN-γ, interferon-gamma; IL, interleukin; MFI, mean fluorescence intensity.
Figure 7
Figure 7
Proposed model of bone marrow (BM) hematopoietic stem cell expansion by the inhibition of TC-PTP (1): In the absence of TC-PTP, HSCs in the BM secrete high amounts of IL-18. (2): IL-18 induces the secretion of IFN-γ and other pro-inflammatory cytokines by nearby cells. (3): This creates a local inflammation (4) leading to activation of Stat1. (5a): The Stat1 signaling pathway can induce the expansion of HSC. (5b): The increased production IFN-γ and other pro-inflammatory cytokines such as IL-12 further contribute to the expansion of HSC. (6): The cytokine milieu also induces increased expression of Sca-1 on the surface of HSC. The localized and temporary inflammatory state triggers a negative feedback mechanism to the HSC and induces the production of IL-18 binding protein (IL-18bp). (5c): The presence of IL-18bp and cytokines expands the number of HSC and (7) facilitates their migration to the periphery. Abbreviations: HSC, hematopoietic stem cell; IFN-γ, interferon-gamma; IL, interleukin.

References

    1. Mohle R, Kanz L. Hematopoietic growth factors for hematopoietic stem cell mobilization and expansion. Semin Hematol. 2007;44:193–202. - PubMed
    1. Ivanovic Z, Boiron JM. Ex vivo expansion of hematopoietic stem cells: Concept and clinical benefit. Transfus Clin Biol. 2009;16:489–500. - PubMed
    1. Trop S, Tremblay ML, Bourdeau A. Modulation of bone marrow-derived endothelial progenitor cell activity by protein tyrosine phosphatases. Trends Cardiovasc Med. 2008;18:180–186. - PubMed
    1. Bourdeau A, Dube N, Tremblay ML. Cytoplasmic protein tyrosine phosphatases, regulation and function: The roles of PTP1B and TC-PTP. Curr Opin Cell Biol. 2005;17:203–209. - PubMed
    1. Bourdeau A, Dube N, Heinonen KM, et al. TC-PTP-deficient bone marrow stromal cells fail to support normal B lymphopoiesis due to abnormal secretion of interferon-gamma. Blood. 2007;109:4220–4228. - PubMed

Publication types

MeSH terms