

Expression profiling of archival tumors for long-term health studies
- PMID: 23136189
- PMCID: PMC3500412
- DOI: 10.1158/1078-0432.CCR-12-1915
Expression profiling of archival tumors for long-term health studies
Abstract
Purpose: More than 20 million archival tissue samples are stored annually in the United States as formalin-fixed, paraffin-embedded (FFPE) blocks, but RNA degradation during fixation and storage has prevented their use for transcriptional profiling. New and highly sensitive assays for whole-transcriptome microarray analysis of FFPE tissues are now available, but resulting data include noise and variability for which previous expression array methods are inadequate.
Experimental design: We present the two largest whole-genome expression studies from FFPE tissues to date, comprising 1,003 colorectal cancer (CRC) and 168 breast cancer samples, combined with a meta-analysis of 14 new and published FFPE microarray datasets. We develop and validate quality control (QC) methods through technical replication, independent samples, comparison to results from fresh-frozen tissue, and recovery of expected associations between gene expression and protein abundance.
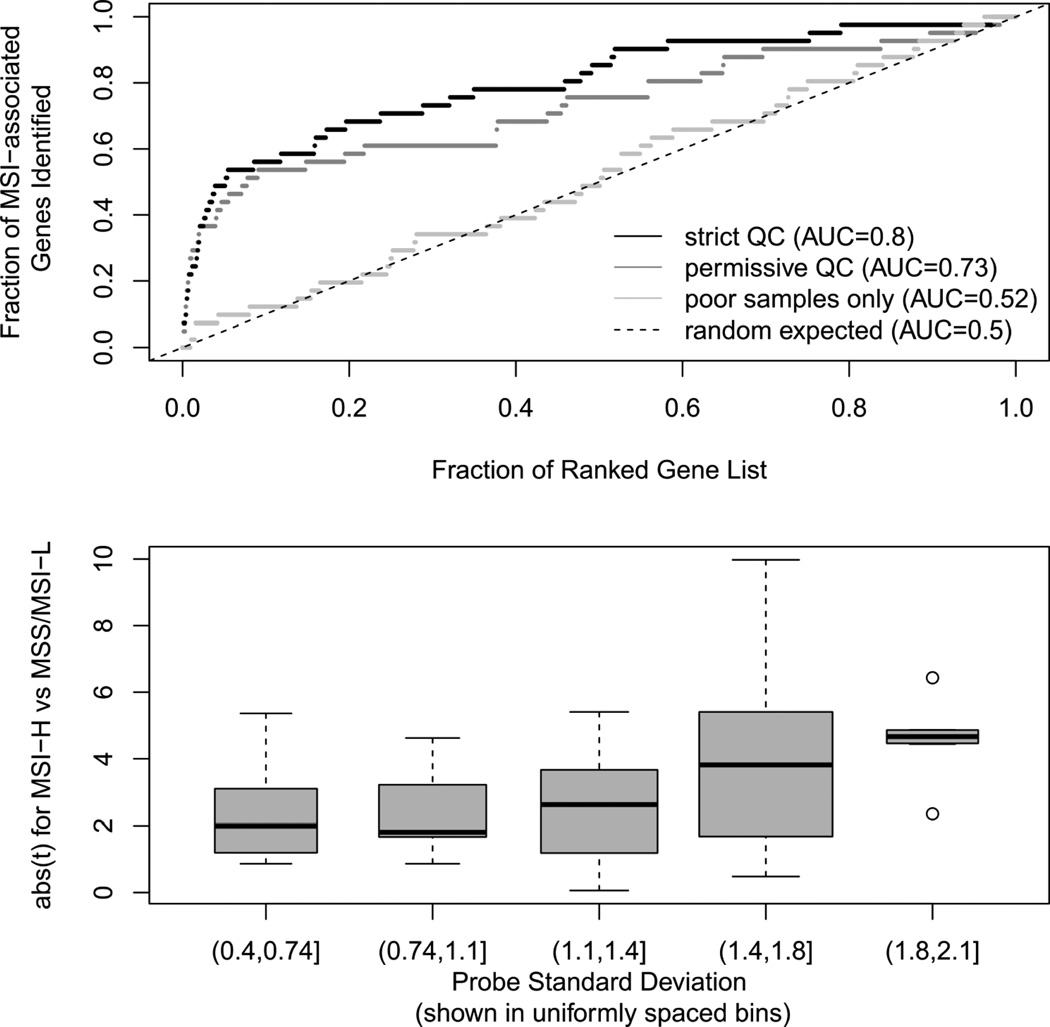
Results: Archival tissues from large, multicenter studies showed a much wider range of transcriptional data quality relative to smaller or frozen tissue studies and required stringent QC for subsequent analysis. We developed novel methods for such QC of archival tissue expression profiles based on sample dynamic range and per-study median profile. This enabled validated identification of gene signatures of microsatellite instability and additional features of CRC, and improved recovery of associations between gene expression and protein abundance of MLH1, FASN, CDX2, MGMT, and SIRT1 in CRC tumors.
Conclusions: These methods for large-scale QC of FFPE expression profiles enable study of the cancer transcriptome in relation to extensive clinicopathological information, tumor molecular biomarkers, and long-term lifestyle and outcome data.
©2012 AACR.
Conflict of interest statement
Figures


Similar articles
-
Robust transcriptional tumor signatures applicable to both formalin-fixed paraffin-embedded and fresh-frozen samples.Oncotarget. 2017 Jan 24;8(4):6652-6662. doi: 10.18632/oncotarget.14257. Oncotarget. 2017. PMID: 28036264 Free PMC article.
-
Mining the Archives: A Cross-Platform Analysis of Gene Expression Profiles in Archival Formalin-Fixed Paraffin-Embedded Tissues.Toxicol Sci. 2015 Dec;148(2):460-72. doi: 10.1093/toxsci/kfv195. Epub 2015 Sep 10. Toxicol Sci. 2015. PMID: 26361796 Free PMC article.
-
Clinical relevance of DNA microarray analyses using archival formalin-fixed paraffin-embedded breast cancer specimens.BMC Cancer. 2011 Jun 16;11:253:1-13. doi: 10.1186/1471-2407-11-253. BMC Cancer. 2011. PMID: 21679412 Free PMC article.
-
Complete solubilization of formalin-fixed, paraffin-embedded tissue may improve proteomic studies.Proteomics Clin Appl. 2013 Apr;7(3-4):264-72. doi: 10.1002/prca.201200031. Epub 2013 Mar 6. Proteomics Clin Appl. 2013. PMID: 23339100 Free PMC article. Review.
-
Analysis of formalin-fixed, paraffin-embedded (FFPE) tissue via proteomic techniques and misconceptions of antigen retrieval.Biotechniques. 2016 May 1;60(5):229-38. doi: 10.2144/000114414. eCollection 2016. Biotechniques. 2016. PMID: 27177815 Review.
Cited by
-
Molecular pathological epidemiology of epigenetics: emerging integrative science to analyze environment, host, and disease.Mod Pathol. 2013 Apr;26(4):465-84. doi: 10.1038/modpathol.2012.214. Epub 2013 Jan 11. Mod Pathol. 2013. PMID: 23307060 Free PMC article. Review.
-
Robust transcriptional tumor signatures applicable to both formalin-fixed paraffin-embedded and fresh-frozen samples.Oncotarget. 2017 Jan 24;8(4):6652-6662. doi: 10.18632/oncotarget.14257. Oncotarget. 2017. PMID: 28036264 Free PMC article.
-
Gene expression, single nucleotide variant and fusion transcript discovery in archival material from breast tumors.PLoS One. 2013 Nov 22;8(11):e81925. doi: 10.1371/journal.pone.0081925. eCollection 2013. PLoS One. 2013. PMID: 24278466 Free PMC article.
-
Pathology Laboratory Archives: Conservation Quality of Nucleic Acids and Proteins for NSCLC Molecular Testing.J Pers Med. 2024 Mar 22;14(4):333. doi: 10.3390/jpm14040333. J Pers Med. 2024. PMID: 38672960 Free PMC article.
-
Feasibility of RNA and DNA extraction from fresh pipelle and archival endometrial tissues for use in gene expression and SNP arrays.Obstet Gynecol Int. 2013;2013:576842. doi: 10.1155/2013/576842. Epub 2013 Oct 26. Obstet Gynecol Int. 2013. PMID: 24282417 Free PMC article.
References
-
- Lewis F, Maughan NJ, Smith V, Hillan K, Quirke P. Unlocking the archive – gene expression in paraffin-embedded tissue. The Journal of Pathology. 2001;195:66–71. - PubMed
Publication types
MeSH terms
Substances
Grants and funding
LinkOut - more resources
Full Text Sources
Other Literature Sources
Medical
Molecular Biology Databases
Research Materials
Miscellaneous
