. 2012 Dec 15;189(12):5841-8.
doi: 10.4049/jimmunol.1201679. Epub 2012 Nov 7.

CD8+ T cell-derived IFN-γ prevents infection by a second heterologous virus

Affiliations

CD8+ T cell-derived IFN-γ prevents infection by a second heterologous virus

Laura Valentine et al. J Immunol. .

Abstract

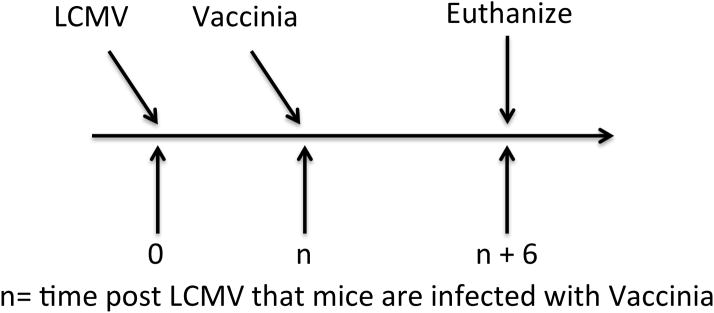
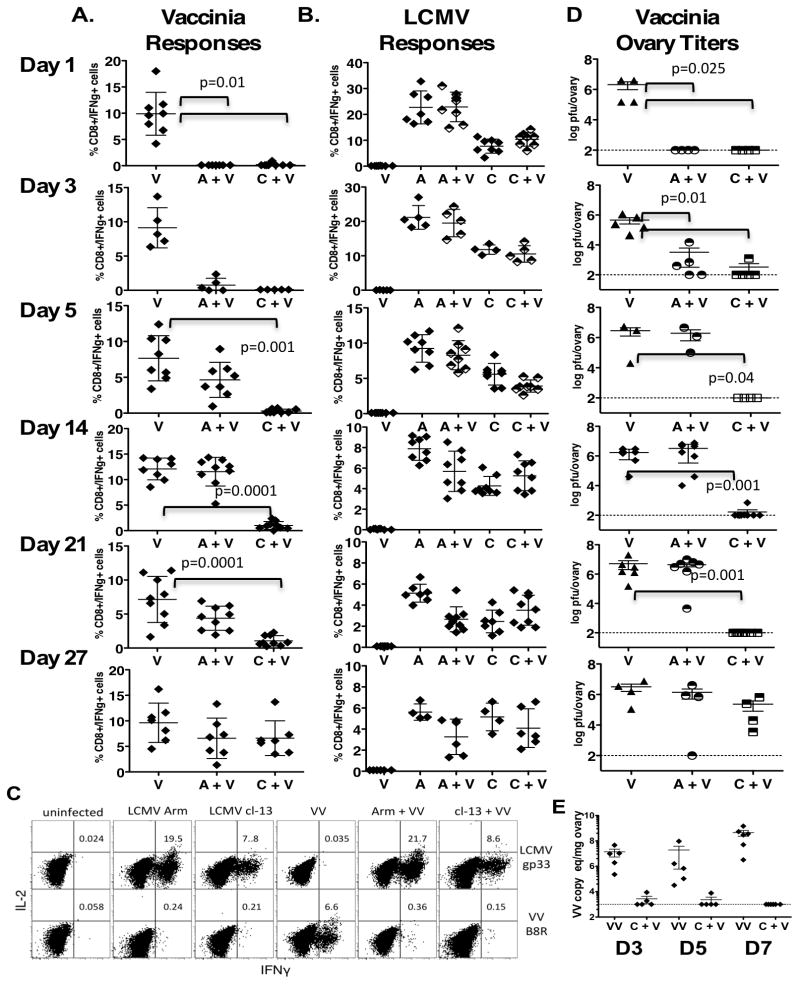
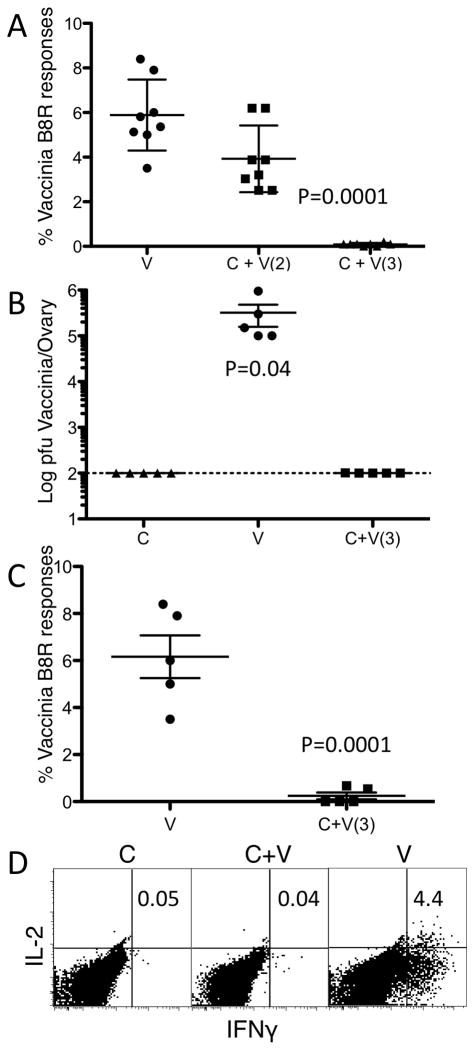
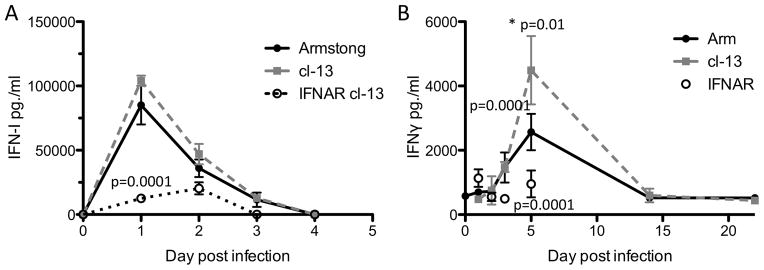
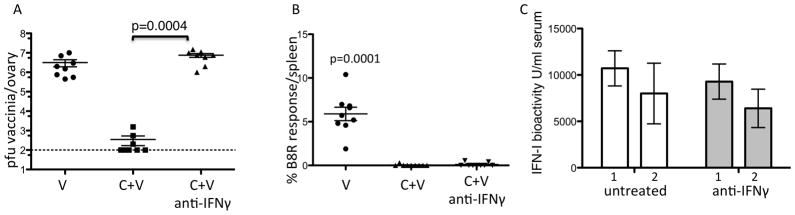
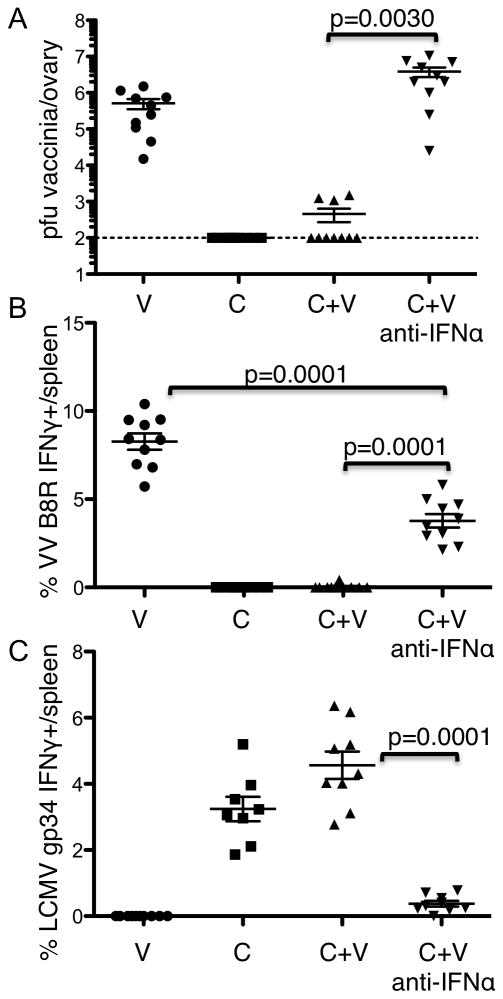
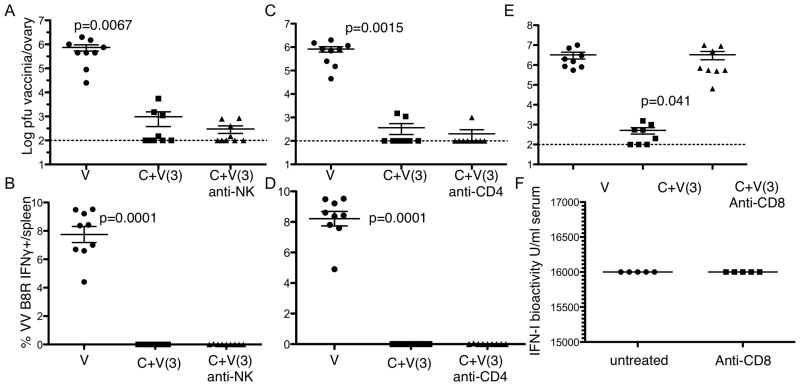
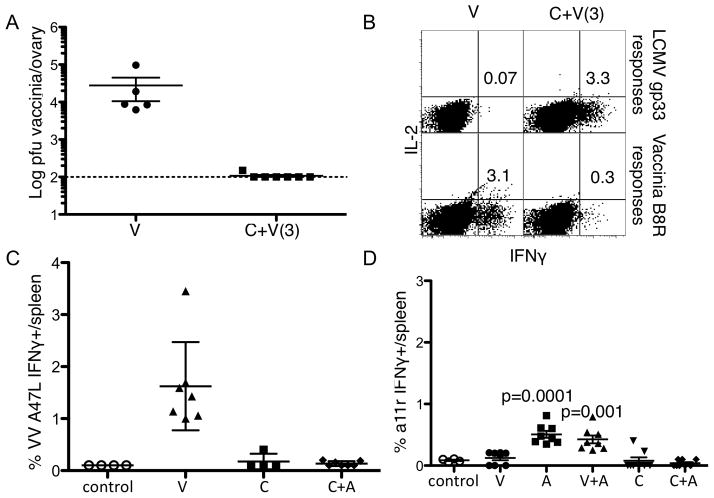
Persistent viral infection is often associated with dysfunctional immune responses against unrelated pathogens. Lymphocytic choriomeningitis virus (LCMV) can establish acute or chronic infections in mice and is widely used as a model for persistent virus infections in humans. Mice infected with LCMV develop a transient defect in Ag-specific immunity against heterologous viral infection. Although it has been proposed that LCMV infection induces an immunosuppressed state within the host, our data show that infected mice successfully clear vaccinia virus through a mechanism that involves CD8(+) T cell-derived IFN-γ. This observation demonstrates that chronic LCMV infection does not impair protective immunity against heterologous viral challenge. Rather, a natural sterilizing immunity is induced following a primary infection that prevents a secondary infection. Our findings suggest a need to re-evaluate current thoughts about the immune suppression that might occur during a persistent infection.


Figures

Figure 1
Figure 1. Experimental Design
Naïve mice are infected i.v. with LCMV clone 13 or clone Armstrong (2×10⁶ pfu). Mice are then are co-infected i.p. with Vaccinia virus (1×10⁶ pfu) at different times (n). Mice are sacrificed 6 days following the secondary Vaccinia infection for analysis.
Figure 2
Figure 2. The kinetics of the non-specific antiviral state during LCMV infection in mice
Mice are infected i.v. with LCMV clone 13 (C) or clone Armstrong (A) (2×10⁶ pfu) at various time-points following i.p. infection with Vaccinia virus (V)(1×10⁶). Virus-specific responses were evaluated 6 days following Vaccinia infection. In vitro peptide stimulation was used to determine (22)the percentage of CD8+ IFN-g+ cells in response to the Vaccinia B8R epitope A. and the LCMV gp34 epitope B C. A representative dot plot of cytokine production. D. A standard plaque assay or E. quantitative real time PCR measured vaccinia virus titers in the ovaries. The numbers (D3, D5 and D7) indicate the time following LCMV that mice were co-infected with Vaccinia virus. A total of 3 independent experiments with similar results were done. Error bars represent mean + SD. All statistical comparisons were made using the two tailed students t-Test.
Figure 3
Figure 3. IFNAR mice can clear a secondary VACCINIA VIRUS infection non-specifically by 72 hours following a primary LCMV infection
Type I IFN receptor knockout mice (IFNAR) were infected with LCMV clone 13 (c) and co-infected either on day 2 or 3 (the day is indicated in parentheses) with 1×10⁴ pfu of Vaccinia virus (v). Vaccinia specific B8R responses were measured in the spleen 30 days following co-infection. A. % IFNγ+ CD8 cells. IFNAR mice were infected with LCMV clone 13 and infected with Vaccinia virus 3 days later. Mice were sacrificed 6 days following VACCINIA VIRUS infection and, B. VACCINIA VIRUS titers in the ovaries and VACCINIA VIRUS specific B8R responses were measured in the spleen, C. % IFNγ+ CD8 cells. D. Representative dot plot of B8R specific IFNγ producing CD8 cells. Data are representative of four to five mice per group and of two to three individual experiments with similar results. Error bars represent mean + SD. Statistics were analyzed by student two-tailed t-Test.
Figure 4
Figure 4. Type I and type II interferon production following LCMV infection
WT mice are infected with LCMV clone 13 or Armstrong at 2×10⁶ pfu i.v. n=5–10/ group. IFNAR mice were infected with LCMV clone 13 at 2×10⁶ pfu i.v. n=5–10/group. WT mice were bled on 1, 2, 3, 5, 14 and 22 days following infection. IFNAR mice were bled out to 5 days post infection. A. Type I IFN responses were measured using a standard bioassay. B. IFNγ responses were measured by a standard ELISA. Day 1 IFN-I levels are significantly decreased in IFNAR mice as compared to all other groups. Day 5 WT LCMV clone 13 IFNγ levels are significantly increased as compared to day 5 Armstrong levels. Day 5 clone 13 infected IFNAR IFNγ levels are significantly decreased as compared to day 5 WT clone 13 IFNγ levels. Error bars represent mean + SD. Statistics performed using the two tailed students t-Test.
Figure 5
Figure 5. The nonspecific clearance of Vaccinia is dependent on IFNγ
Wild type mice were infected with LCMV clone 13 at 2×10⁶ pfu i.v. Mice were co-infected with Vaccinia on day 3. Six days after co-infection mice were sacrificed. A. Levels of Vaccinia in ovaries by standard plaque assay. B. % Vaccinia B8R IFNγ producing cells in the spleen. C. Day 1 and 2 post clone 13 infection IFN-I bioactivity as measured by the standard IFN-I bioassay white bars are untreated and grey bars are anti-IFNγ treated. Error bars represent mean + SD. Two independent experiments combined n=8–10/group. Statistics performed using the two tailed students t-Test.
Figure 6
Figure 6. Type I IFN signaling is required for an IFNγ response capable of clearing high dose VACCINIA VIRUS infection
WT mice were treated with 2.5mg of an anti-IFNAR antibody. One day later the mice were infected with LCMV clone 13 at 2×10⁶ pfu i.v. Three days after the LCMV infection mice were co-infected with VACCINIA VIRUS. Six days following Vaccinia infection mice were analyzed. A. Vaccinia titers in the ovary. Splenocytes were harvested and antigen specific responses to B. Vaccinia B8R and. C. LCMV gp34 were measured. Two independent experiments were combined n=8–10/group. Error bars represent mean + SD. Statistics performed using the two tailed students t-Test.
Figure 7
Figure 7. The in vivo antiviral state is dependent on CD8+ T cells
Wild type mice were infected with LCMV clone 13 (c). Three days later some mice were co-infected with vaccinia virus (c+v). Some mice were treated with the NK depleting antibody (PK136) on day’s 0 and 3 post LCMV infection. A, Vaccinia virus titers in the ovaries and B, % CD8+ T cell response to the dominant vaccinia epitope B8R responses. Some infected mice were treated at the time of LCMV infection with anti-CD4 antibody (GK1.5) and C. Vaccinia virus titers in the ovaries and D, CD8+ T cell response to the vaccinia epitope B8R responses. Some mice were treated with anti-CD8 antibody (2.43) on day’s 0 and 3 post LCMV infection and E, Vaccinia virus titers in the ovary measured. F. Type I IFN bioactivity was measured day 2 post clone 13 infection. Plots represent the combined data from at least 2 independent experiments. Error bars represent mean + SD. Population distributions were compared by nonparametric two-tailed student t-Test.
Figure 8
Figure 8. The IFNγ antiviral state is independent of perforin, sub-dominant, or cross-reactive T cell responses
Perforin knockout mice were infected with LCMV clone 13 (c) and some were co-infected with Vaccinia (c+v) three days later. A, Vaccinia virus titers in the ovaries and B, % CD8+ T cell response to the dominant vaccinia epitope B8R responses. WT mice were infected with LCMV clone 13 (C) and co-infected with VACCINIA VIRUS on day 8 post primary LCMV infection. Six days after VACCINIA VIRUS co-infection mice were sacrificed and C, VACCINIA VIRUS specific A47L responses were measured. WT mice infected with either LCMV Arm (A) or clone 13 (C) and were co-infected with VACCINIA VIRUS 21 days later. E, % IFNγ produced by cross reactive a11r CD8 T cell responses were measured in uninfected controls, singly or co-infected mice. Vaccinia virus titers represent the data from one of at least 2 independent experiments with similar results. Error bars represent mean + SD. Population distributions were compared by nonparametric two-tailed student t-Test.

References

    1. Golden-Mason L, Palmer B, Klarquist J, Mengshol JA, Castelblanco N, Rosen HR. Upregulation of PD-1 expression on circulating and intrahepatic hepatitis C virus-specific CD8+ T cells associated with reversible immune dysfunction. J Virol. 2007;81:9249–9258. - PMC - PubMed
    1. Gruener NH, Lechner F, Jung MC, Diepolder H, Gerlach T, Lauer G, Walker B, Sullivan J, Phillips R, Pape GR, Klenerman P. Sustained dysfunction of antiviral CD8+ T lymphocytes after infection with hepatitis C virus. J Virol. 2001;75:5550–5558. - PMC - PubMed
    1. Wedemeyer H, He XS, Nascimbeni M, Davis AR, Greenberg HB, Hoofnagle JH, Liang TJ, Alter H, Rehermann B. Impaired effector function of hepatitis C virus-specific CD8+ T cells in chronic hepatitis C virus infection. J Immunol. 2002;169:3447–3458. - PubMed
    1. van Grevenynghe J, Cubas RA, Dafonseca S, Metcalf T, Tremblay CL, Trautmann L, Sekaly RP, Schatzle J, Haddad EK. Foxo3a: An integrator of immune dysfunction during HIV infection. Cytokine Growth Factor Rev. 2012;23:215–221. - PMC - PubMed
    1. Nixon DE, Landay AL. Biomarkers of immune dysfunction in HIV. Current opinion in HIV and AIDS. 2010;5:498–503. - PMC - PubMed

Publication types

MeSH terms

Substances