. 2013 May;6(3):608-21.
doi: 10.1242/dmm.010900. Epub 2012 Nov 7.

Neurons and cardiomyocytes derived from induced pluripotent stem cells as a model for mitochondrial defects in Friedreich's ataxia

Affiliations

Neurons and cardiomyocytes derived from induced pluripotent stem cells as a model for mitochondrial defects in Friedreich's ataxia

Aurore Hick et al. Dis Model Mech. 2013 May.

Abstract

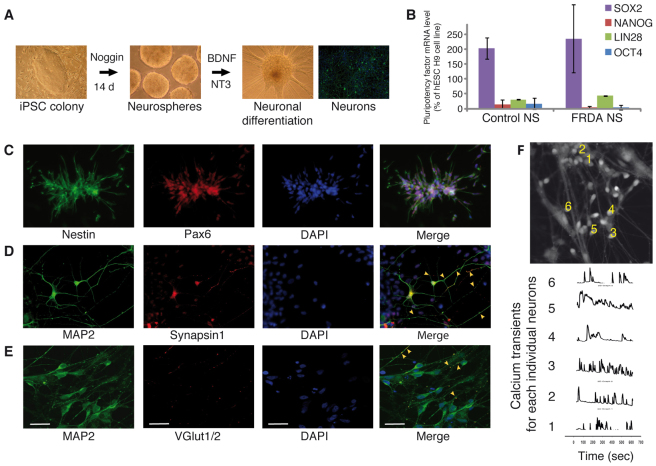
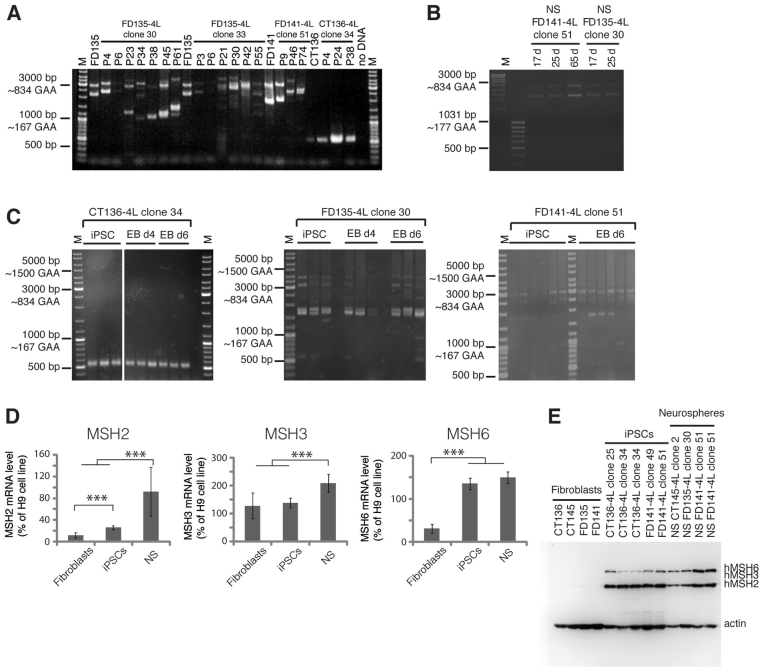
Friedreich's ataxia (FRDA) is a recessive neurodegenerative disorder commonly associated with hypertrophic cardiomyopathy. FRDA is due to expanded GAA repeats within the first intron of the gene encoding frataxin, a conserved mitochondrial protein involved in iron-sulphur cluster biosynthesis. This mutation leads to partial gene silencing and substantial reduction of the frataxin level. To overcome limitations of current cellular models of FRDA, we derived induced pluripotent stem cells (iPSCs) from two FRDA patients and successfully differentiated them into neurons and cardiomyocytes, two affected cell types in FRDA. All FRDA iPSC lines displayed expanded GAA alleles prone to high instability and decreased levels of frataxin, but no biochemical phenotype was observed. Interestingly, both FRDA iPSC-derived neurons and cardiomyocytes exhibited signs of impaired mitochondrial function, with decreased mitochondrial membrane potential and progressive mitochondrial degeneration, respectively. Our data show for the first time that FRDA iPSCs and their neuronal and cardiac derivatives represent promising models for the study of mitochondrial damage and GAA expansion instability in FRDA.


Figures

Fig. 1.
Fig. 1.
Generation and characterisation of iPSC cell lines from control and FRDA fibroblasts. (A) PCR analysis of FXN GAA repeat length in fibroblast cell lines (FD135, CT136 and FD141) and iPSCs (FD135-4L, CT136-4L and FD141-4L clones). CT136 corresponds to an unaffected control; FD135 and FD141 correspond to two unrelated FRDA patients. Numbers represent different iPSC clones isolated for each cell lines. M, molecular weight marker. (B) Representative colonies of control and FRDA iPSCs stained positive for the pluripotency markers TRA1-60 (red), TRA1-81 (red) and NANOG (green). Scale bars: 200 μm. (C) qRT-PCR analysis of frataxin expression relative to GADPH in control and FRDA iPSCs. The value of CT136-4L clone 34 was arbitrarily set to 100. (D) Western blot of whole cell extracts from control or FRDA iPSCs. The intermediate (hFXN 42-210) and mature (hFXN 81-210) forms of frataxin are detected. β-tubulin is used as a loading control. Protein levels were quantified after normalisation with β-tubulin and expressed as a percentage of control level (CT136-4L clone 34 was arbitrarily set at 100); n=3 in each group. Data are presented as mean ± s.d.
Fig. 2.
Fig. 2.
Differentiation of FRDA iPSCs into neurons and their characterisation. (A) Schematic view of the neural differentiation protocol. Representative images show an iPSC colony treated with noggin for 14 days, cultured as neuropheres, and neuropheres undergoing neural differentiation in the presence of neurotrophic factors, BDNF and NT3 (bright fields) and neurons (immunostained for β-tubulin III; green). (B) qRT-PCR analysis of the expression levels of endogenous SOX2, NANOG, LIN28 and OCT4 relative to GADPH in control and FRDA neurospheres (NS) normalised to hESC H9. The data are presented as mean ± s.d. (C) Representative iPSC-derived neurospheres (FD135-4L clone 30) stained positive for the neural stem cell markers Nestin (green) and Pax6 (red). Nuclei are counterstained with DAPI (blue). The majority of cells coexpress both markers. (D,E) Representative iPSC-derived neurons at 45 days (FD135-4L clone 30) stained positive for MAP2 (green). (D) Positive labeling for synapsin1 (red) demonstrates synapse formation (see arrowheads in merge). (E) A subset of cells stain positive for the glutamate vesicular transporter VGlut1/2 (red, see arrowheads in merge). (F) Top: unprocessed fluorescence image of iPSC-derived neurons at 35 days (FD135-4L clone 30) loaded with the calcium indicator Oregon Green 488 BAPTA 1. Bottom: representative traces from numbered neurons (1–6) showing spontaneous calcium spikes. Scale bars: 20 μm.
Fig. 3.
Fig. 3.
FRDA neurons are functionally impaired and have reduced mitochondrial membrane potential. (A) Representative images of iPSC-derived 8-day-old differentiating neurospheres for both control and FRDA clones stained positive for β-tubulin III. (B) PCR analysis of FXN GAA repeat length in iPSCs, neurospheres (NS) and neurons (N) from representative control (CT136-4L clone 38) and FRDA (FD135-4L clone 30 and FD141-4L clone 51) lines. M, molecular weight marker. (C) qRT-PCR analysis of frataxin expression relative to GADPH in control (CT) and FRDA (FD) iPSCs and neurospheres (NS). The value of iPSC CT136-4L clone 25 was arbitrarily set to 100. The data are presented as mean ± s.d. (D) Electrophysiological characteristics of iPSC-derived neurons. Representative traces obtained from current-clamp recordings in maturating iPSC-derived neurons at days 34–39 are shown: (Da) Control neuron (CT 136-4L clone 38) showing spontaneous repetitive action potentials, a recording never detected in any FRDA neurons. (Db) Control neuron (CT 136-4L clone 38) showing repetitive depolarisation-evoked action potentials. (Dc) FRDA neuron (FD141-4L clone 51) showing a single depolarisation-evoked action potential. (Dd) Quantification of iPSC-derived control and FRDA neurons expressing voltage-dependent sodium current, evoked and spontaneous action potentials determined by patch-clamp recording. (De) Quantification of iPSC-derived control and FRDA neurons participating in spontaneous calcium oscillations. (E) Loading of iPSC-derived neurons with the mitochondrial fluorescent dye TMRM. (Ea) Upper panels show representative fluorescent images of FRDA and control neuronal cultures loaded with TMRM. Lower panels show flow cytometry profile with TMRM fluorescence. (Eb) Quantification of mean fluorescence intensity in TMRM-positive cells in R2; **P<0.01, ***P<0.001. (F) Electron microscopy analysis of FRDA iPSCs neurons at 43 days shows no ultrastructural abnormality. Fb is a higher magnification image of the boxed area shown in Fa; n, nucleus; m, mitochondria.
Fig. 4.
Fig. 4.
Differentiation of iPSCs into cardiomyocytes and their characterisation. (A) Schematic view of the cardiomyocyte differentiation protocol with representative images showing an iPSC colony, EBs and a beating area (bright fields). (B) qRT-PCR analysis of cardiac marker expression relative to the 18S housekeeping gene in different pools of beating areas from control (CT136-4L clone 34) and patient (FD141-4L clones 49 and 51) iPSCs, normalised to human adult heart. (C) Representative iPSC-derived beating areas from control (CT136-4L clone 34) and FRDA (FD141-4L clone 49) lines immunostained with cardiac troponin T to reveal cardiomyocyte organisation. (D) Representative electron microscopy images of iPSC-derived cardiomyocytes showing different degrees of structural maturity and intercellular junctions. (Da) Immature cardiomyocyte with organised contractile fibres or myofibrils without clear defined Z-line and with accumulation of ribosomes. (Db) Mature cardiomyocyte with dense myofibrillar sarcomeres bounded by straight dense Z-lines. Note that mitochondria are elongated and aligned in between myofibrils. (Dc) The presence of intercalated disks formed by desmosomes and fascia adherens, and occasionally gap junction (inset) connect different cardiomyocytes (CM1 and CM2). (Dd) Rare binucleated cardiomyocytes were observed (arrow points to centriole). d, desmosome; f, myofibril; fa, fascia adherens; g, gap junction; m, mitochondria; r, ribosome.
Fig. 5.
Fig. 5.
FRDA cardiomyocytes present a mitochondrial phenotype. (A) PCR analysis of FXN GAA repeat length in representative pools of beating areas derived from control and FRDA iPSCs (left panel). qRT-PCR analysis of the expression levels of frataxin relative to GADPH in the pools of beating areas from control (CT136-4L clone 34) and FRDA (FD141-4L clones 49 and 51) iPSCs (right panel). The value of one pool of beating areas from the control was arbitrarily set to 100. The data are presented as mean ± s.d. **P<0.01, ***P<0.001. (B) Analysis of the beating area contraction profiles by time-lapse imaging. Beating rate (beats per minutes; bpm) distribution (sectors and boxplot) and frequency of arrhythmic events (bars) are shown. The contraction rate distribution is categorised as slow (<60 bpm), intermediate (60-90 bpm) and fast (>90 bpm). (C) Ultrastructural changes in cardiomyocytes derived from FRDA iPSCs. No ultrastructural abnormality was observed in the organisation of the contractile fibre with clear defined sarcomeres. (Ca) Abnormal mitochondrial proliferation and/or accumulation. (Cb,c) Degenerating dark mitochondria with poorly defined cristae, mitochondria with hypertrophic cristae and onion-like mitochondria with coiled cristae. Inset: normal mitochondrion. cc, coiled cristae; dm, cristae; f, contractile fibre; hc, hypertrophic cristae; m, mitochondria; nm, normal mitochondrion.
Fig. 6.
Fig. 6.
iPSC show GAA instability over passages and increased expression level of mismatch repair enzymes. (A) PCR analysis of FXN GAA repeat length in fibroblast cell lines (FD135 and CT136) and iPSC clones from control and FRDA iPSCs at different passages (P#). M, molecular weight marker. (B) PCR analysis of FXN GAA repeat length in neurospheres. (C) PCR analysis of FXN GAA repeat length in EBs. (D) qRT-PCR analysis of MSH2, MSH3 and MSH6 expression in fibroblasts (n=8), iPSCs (n=6) and neurospheres (NS; at least 2 weeks of culture, n=7 from four different iPSC clones). No significant difference was seen between control and FRDA iPSC-derived cells. The data are represented as mean ± s.d. ***P<0.005. (E) Western blot analysis of total protein extracts from fibroblasts, iPSCs and neurospheres. Strong bands corresponding to MSH2 and MSH6 are detected in iPSCs and neurospheres; a weak band corresponding to MSH3 is detected in iPSCs and neurospheres (see supplementary material Fig. S8 for longer exposure). Actin was used as a loading control.

References

    1. Abramov A. Y., Smulders-Srinivasan T. K., Kirby D. M., Acin-Perez R., Enriquez J. A., Lightowlers R. N., Duchen M. R., Turnbull D. M. (2010). Mechanism of neurodegeneration of neurons with mitochondrial DNA mutations. Brain 133, 797–807 - PMC - PubMed
    1. Al-Mahdawi S., Pinto R. M., Varshney D., Lawrence L., Lowrie M. B., Hughes S., Webster Z., Blake J., Cooper J. M., King, R., et al. (2006). GAA repeat expansion mutation mouse models of Friedreich ataxia exhibit oxidative stress leading to progressive neuronal and cardiac pathology. Genomics 88, 580–590 - PMC - PubMed
    1. Calmels N., Schmucker S., Wattenhofer-Donzé M., Martelli A., Vaucamps N., Reutenauer L., Messaddeq N., Bouton C., Koenig M., Puccio H. (2009). The first cellular models based on frataxin missense mutations that reproduce spontaneously the defects associated with Friedreich ataxia. PLoS ONE 4, e6379. - PMC - PubMed
    1. Campuzano V., Montermini L., Moltò M. D., Pianese L., Cossée M., Cavalcanti F., Monros E., Rodius F., Duclos F., Monticelli A., et al. (1996). Friedreich’s ataxia: autosomal recessive disease caused by an intronic GAA triplet repeat expansion. Science 271, 1423–1427 - PubMed
    1. Campuzano V., Montermini L., Lutz Y., Cova L., Hindelang C., Jiralerspong S., Trottier Y., Kish S. J., Faucheux B., Trouillas P., et al. (1997). Frataxin is reduced in Friedreich ataxia patients and is associated with mitochondrial membranes. Hum. Mol. Genet. 6, 1771–1780 - PubMed

Publication types

MeSH terms

Substances