. 2012 Nov 7;32(45):15759-68.
doi: 10.1523/JNEUROSCI.1310-12.2012.

Gene expression identifies distinct ascending glutamatergic pathways to frequency-organized auditory cortex in the rat brain

Affiliations

Gene expression identifies distinct ascending glutamatergic pathways to frequency-organized auditory cortex in the rat brain

Douglas A Storace et al. J Neurosci. .

Abstract

A conserved feature of sound processing across species is the presence of multiple auditory cortical fields with topographically organized responses to sound frequency. Current organizational schemes propose that the ventral division of the medial geniculate body (MGBv) is a single functionally homogenous structure that provides the primary source of input to all neighboring frequency-organized cortical fields. These schemes fail to account for the contribution of MGBv to functional diversity between frequency-organized cortical fields. Here, we report response property differences for two auditory fields in the rat, and find they have nonoverlapping sources of thalamic input from the MGBv that are distinguished by the gene expression for type 1 vesicular glutamate transporter. These data challenge widely accepted organizational schemes and demonstrate a genetic plurality in the ascending glutamatergic pathways to frequency-organized auditory cortex.


Figures

Figure 1.
Figure 1.
A1 and cSRAF have spatially nonoverlapping sound frequency response organization and distinct time course and magnitude responses to noise stimuli. A, Optical imaging reveals intrinsic metabolic responses to tone sequences. Color indicates BF at that pixel. The BF gradient directions were used to locate A1, VAF, cSRAF, rSRAF, PAF, and AAF (Higgins et al., 2010). Positions for recording the spike rate responses to noise indicated with black (A1), gray (cSRAF), and white (A1, higher BF) circles. Inset indicates the approximate area of the recording window with the centers of A1 and cSRAF marked with circles. B, Exemplar regional poststimulus time spike rate responses to noise; fits to the corresponding data. C, Mean response magnitudes were larger in A1 (A1: 110 ± 37 spikes/s, cSRAF: 94 ± 37 spikes/s; p < 0.01). D, Mean response delays were shorter in A1 (t1: A1 = 15 ± 3 ms, cSRAF = 18 ± 4 ms, p < 0.001, tp: A1 = 23 ± 5 ms, cSRAF = 28 ± 6 ms, p < 0.001). E, Mean slopes of the response were larger in A1 (Rising: A1 = 36 ± 16 spike rate/ms, cSRAF = 26 ± 15 spike rate/ms, p < 0.001, Falling: A1 = 5 ± 3 spike rate/ms, cSRAF = 4 ± 2 spike rate/ms, p < 0.001). F, Response delays increased with ventral position shifts from A1 to cSRAF (r = 0.7, p < 0.001). Data in C–E are means from 250 recording sites in 15 rats; error bars indicate SEM. All p-values are the result of two-tailed t tests. The positions of auditory cortical fields are labeled as defined in this and subsequent figures. Scale bar, 1 mm.
Figure 2.
Figure 2.
A1 and cSRAF both contain high concentrations of VGLUT2 protein in the middle cell layers III and IV, whereas Te3 does not. A, Optical intrinsic imaging was used to map the frequency response organization of the auditory cortex to guide fluorescent bead injections (circles) into A1 and cSRAF. B, E, Nissl-reacted sections demonstrate the location and cytoarchitectonics of both regions with arrows indicating the estimated boundaries between cortical fields. C, F, Sections immunoreacted for VGLUT2 demonstrate dense VGLUT2 protein expression in the middle cortical layers. D, G, High-magnification photomicrographs from C and F (white boxes) demonstrate VGLUT2 terminals (VGLUT2-ir). Scale bars: A, 0.5 mm; B, C, E, F, 1 mm; D, G, 0.05 mm. The region labeled rSRAF in B and C is near the cSRAF and rSRAF border. Position of the rhinal fissure is labeled “rf” in this and subsequent figures. VGLUT2-ir, VGLUT2 immunoreactive.
Figure 3.
Figure 3.
Optical intrinsic imaging, tract tracing, and in situ hybridization distinctions between frequency-organized auditory cortical fields A1 and cSRAF. A, Intrinsic imaging map with a surface blood vessel overlay indicates the BF-matched positions for injection sites (colored circles) into A1 and cSRAF. B–D, Adjacent sections from caudal MGB (−5.98 mm from bregma) processed for Nissl (B), CTB, CTBG (C) and VGLUT1/CTBG (D). E–G, Adjacent sections from rostral MGB (−5.34 mm from bregma) processed for Nissl (E), CTB, CTBG (F), and VGLUT1/CTBG (G). Data illustrated in A–G are from the same animal. H, Sagittal drawing indicating the approximate positions of sections shown in C and F. I, J, Population summary bar graphs for a caudal-to-rostral series of sections of mean percentage of neurons that project to A1 and cSRAF (I, N = 8 animals) and neurons that express VGLUT1 mRNA (J, N = 5 animals). Error bars indicate SEM. Sections in C, D and F, G are included in our population analysis as sections 3 and 7, respectively, and have their cytoarchitectonic boundaries drawn in Figure 5, C and G. Scale bars: A, 1 mm; B–G, 0.5 mm; H, 1 mm. LGN, Lateral geniculate nucleus; M, medial; D, dorsal; V, ventral and SG, suprageniculate divisions of the medial geniculate body; IC, inferior colliculus; SC, superior colliculus; cc, corpus callosum.
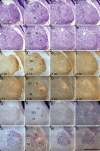
Figure 4.
Figure 4.
Photomicrographs of three adjacent series of sections from the same animal in 160 μm caudal-to-rostral steps through the MGB demonstrate the caudal-rostral distribution of neurons that project to A1 and cSRAF, and those that express VGLUT1 mRNA. A–H, Nissl-stained sections demonstrate MGB cytoarchitecture along the caudal-rostral axis. I–P, CTB and CTBG double-reacted sections demonstrate that neurons that project to cSRAF (brown) and A1 (gold) are found in the caudal and rostral parts of MGB, respectively. Numbers indicate approximate distance (mm) from bregma. Q–X, Sections reacted for both CTBG and VGLUT1 mRNA demonstrate the caudal-to-rostral increase in the total number of neurons expressing VGLUT1 mRNA (blue), and the areal pattern of neurons that also project to A1 (gold). Scale bar, 1 mm.
Figure 5.
Figure 5.
Areal plots of MGB neurons that project to A1 and cSRAF and neurons that express VGLUT1 mRNA. A–H, MGB division boundaries and cell position plots of sections double-reacted for CTB and CTBG showing the caudal-to-rostral separation of neurons that project to cSRAF (red) and A1 (black). I–P, MGB division boundaries and cell position plots of sections double-reacted for retrograde tracer injections into A1 (CTBG), and processed for VGLUT1 mRNA using in situ hybridization demonstrate neurons expressing VGLUT1 mRNA (blue), neurons that project to A1 that express VGLUT1 mRNA (black), and those that do not express the gene (yellow). Q–X, MGB division boundaries and cell position plots of sections processed to reveal retrograde tracer following injections into cSRAF (CTBG), and double-reacted for VGLUT1 mRNA using in situ hybridization demonstrate neurons that express VGLUT1 mRNA (blue), neurons that project to cSRAF that express VGLUT1 mRNA (black), and those that do not express the gene (red). Neurons expressing VGLUT1 mRNA were primarily found in MGBv and MGBd, and the number of VGLUT1+ neurons increased from caudal-to-rostral MGB. The majority of neurons that project to A1 also expressed VGLUT1 mRNA (I–P, black), whereas most neurons that project to cSRAF do not express the gene (Q–X, red). Sections in A–P and Q–X are from two different animals. Scale bar, 0.5 mm.
Figure 6.
Figure 6.
Injections into frequency-matched A1 and cSRAF labeled similar numbers (A) and percentages (B) in each MGB division, with the majority located in the MGBv. A slightly higher percentage of MGBd neurons projected to cSRAF than to A1 (t(14) = −2.3, p = 0.04), and slightly more SG neurons projected to A1 than to cSRAF (t(14) = 3.4, p < 0.05). Data are means and SEM from eight animals. *p < 0.05 using a two-tailed t test.
Figure 7.
Figure 7.
Neurons that project to A1 and cSRAF can be distinguished by the expression of VGLUT1 mRNA. Brain sections were dual-processed to reveal retrograde tracer and in situ hybridization for VGLUT1 mRNA. A–D, Photomicrographs of dual-processed tissue. A, C, An example of label patterns following injection into cSRAF in one animal. Neurons in caudal MGB were densely labeled with retrograde tracer (A) but did not express VGLUT1 mRNA as evidenced by the lack of purple reaction product. VGLUT1 expressing neurons (purple) in rostral MGB of the same animal lacked retrograde label (C). B, D, An example of label patterns following injection into A1 in a second animal. Neurons in caudal MGB were not labeled with retrograde tracer (B), nor did they express VGLUT1 mRNA. In contrast, neurons in rostral MGB expressed VGLUT1 mRNA, and were double-labeled with retrograde tracer following injections into A1 (D). E–G, High-magnification photomicrographs of the three types of labeled neurons taken from the white boxes in D. E, neurons that expressed VGLUT1 mRNA; F, retrogradely labeled neurons; and G, retrogradely labeled neurons that expressed VGLUT1 mRNA. H, I, Summary of data from 2 and 3 animals injected in cSRAF and A1, respectively. H, Most labeled neurons that projected to A1 expressed VGLUT1 mRNA (81 ± 5%), whereas most labeled neurons that projected to cSRAF did not (98 ± 0.8%). I, The mean percentage of A1 projecting neurons positive for VGLUT1 mRNA was highest in the rostral part of the MGB. Error bars indicate SEM. Scale bars: A, 0.25 mm; B–E, 0.25 μm. A1pj, A1 projecting.
Figure 8.
Figure 8.
A parallel thalamocortical pathway organization distinguished by thalamic connections and VGLUT1 mRNA expression patterns as demonstrated in this study indicates novel organization principles. A, Neurons in rostral MGB that express VGLUT1 gene terminate in A1 where recordings demonstrate short-latency, high spike rates to noise. B, Neurons in caudal MGB that do not express the VGLUT1 gene terminate in cSRAF where recordings demonstrate longer-latency, lower spike rate responses to noise. The organization scheme illustrated is supported by data in the present study that finds a dense terminal band of VGLUT2 protein in both A1 and cSRAF, and a systematic change in cortical connections and VGLUT1 expression pattern differences between caudal versus rostral MGB. This scheme is consistent with the hypothesis that there exists a dense VGLUT1 protein innervation to layer IV of A1, but not cSRAF.

Similar articles

Cited by

References

    1. Arnault P, Roger M. Ventral temporal cortex in the rat: connections of secondary auditory areas Te2 and Te3. J Comp Neurol. 1990;302:110–123. - PubMed
    1. Barroso-Chinea P, Castle M, Aymerich MS, Pérez-Manso M, Erro E, Tuñon T, Lanciego JL. Expression of the mRNAs encoding for the vesicular glutamate transporters 1 and 2 in the rat thalamus. J Comp Neurol. 2007;501:703–715. - PubMed
    1. Basbaum AI. A rapid and simple silver enhancement procedure for ultrastructural localization of the retrograde tracer WGAapoHRP-Au and its use in double-label studies with post-embedding immunocytochemistry. J Histochem Cytochem. 1989;37:1811–1815. - PubMed
    1. Budinger E, Scheich H. Anatomical connections suitable for the direct processing of neuronal information of different modalities via the rodent primary auditory cortex. Hear Res. 2009;258:16–27. - PubMed
    1. Cant NB, Benson CG. Multiple topographically organized projections connect the central nucleus of the inferior colliculus to the ventral division of the medial geniculate nucleus in the gerbil, Meriones unguiculatus. J Comp Neurol. 2007;503:432–453. - PubMed

Publication types

Substances

LinkOut - more resources