. 2012 Nov 7;32(45):15769-78.
doi: 10.1523/JNEUROSCI.2180-12.2012.

Stimulation of electro-olfactogram responses in the main olfactory epithelia by airflow depends on the type 3 adenylyl cyclase

Affiliations

Stimulation of electro-olfactogram responses in the main olfactory epithelia by airflow depends on the type 3 adenylyl cyclase

Xuanmao Chen et al. J Neurosci. .

Abstract

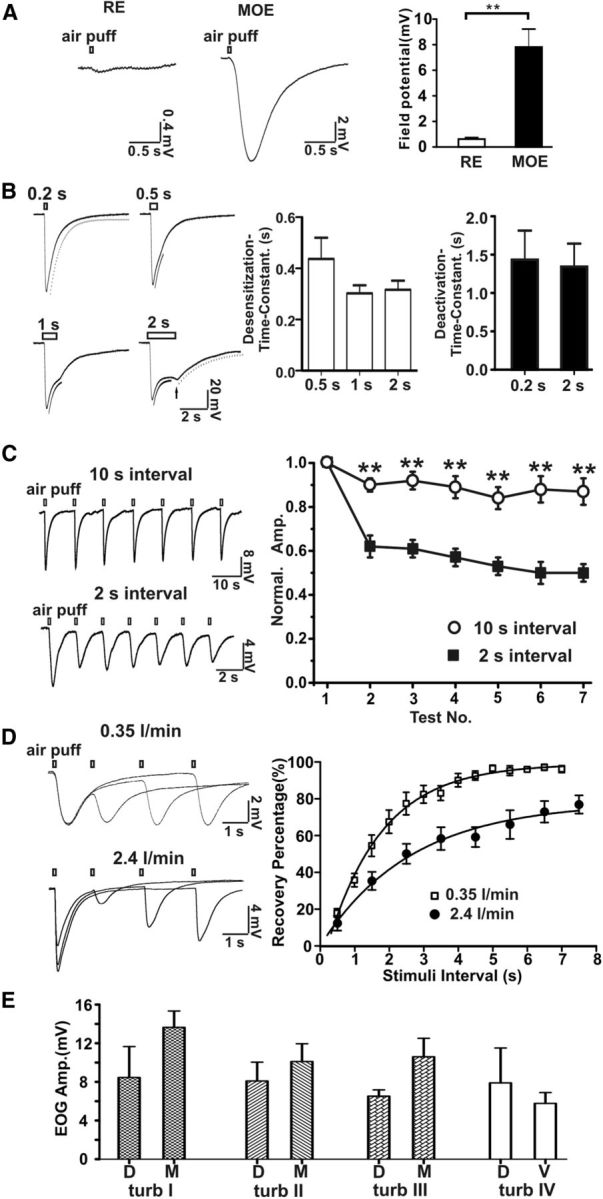
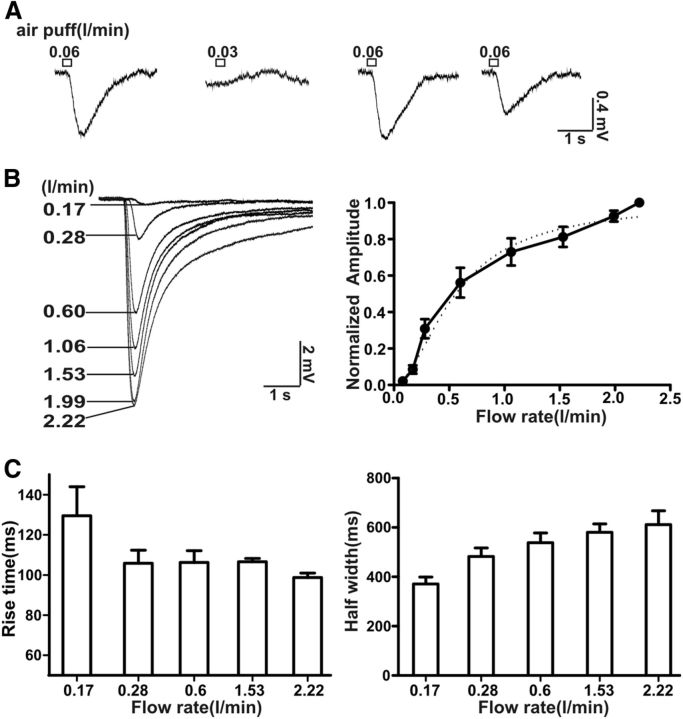
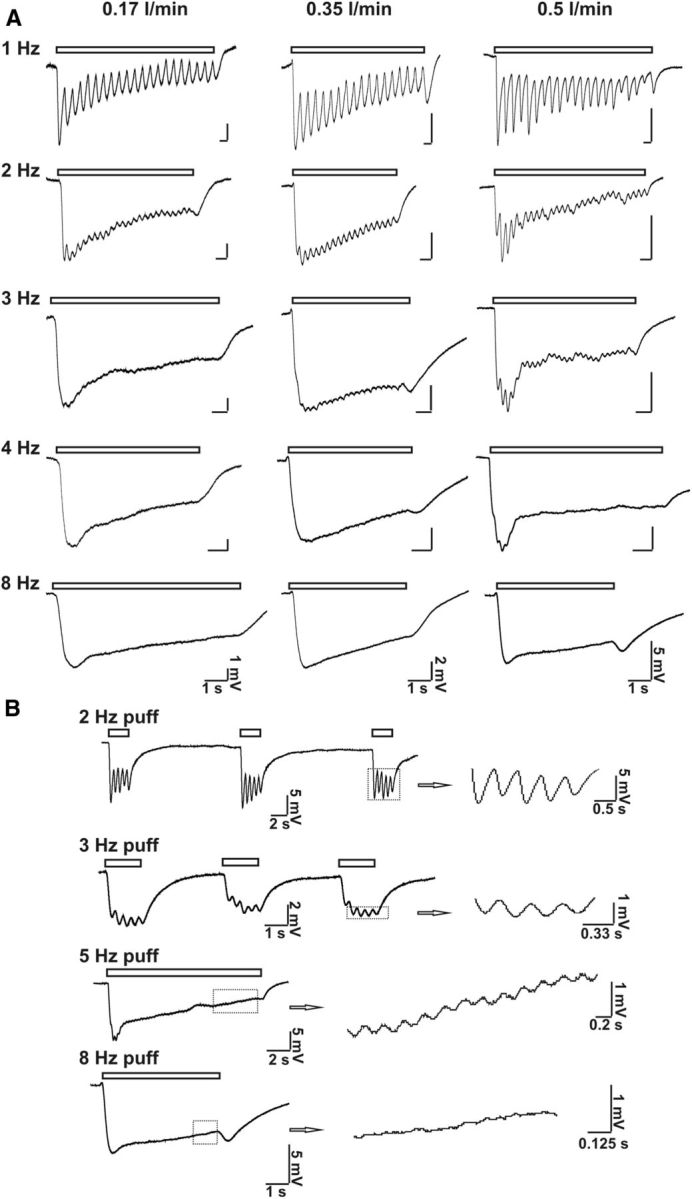
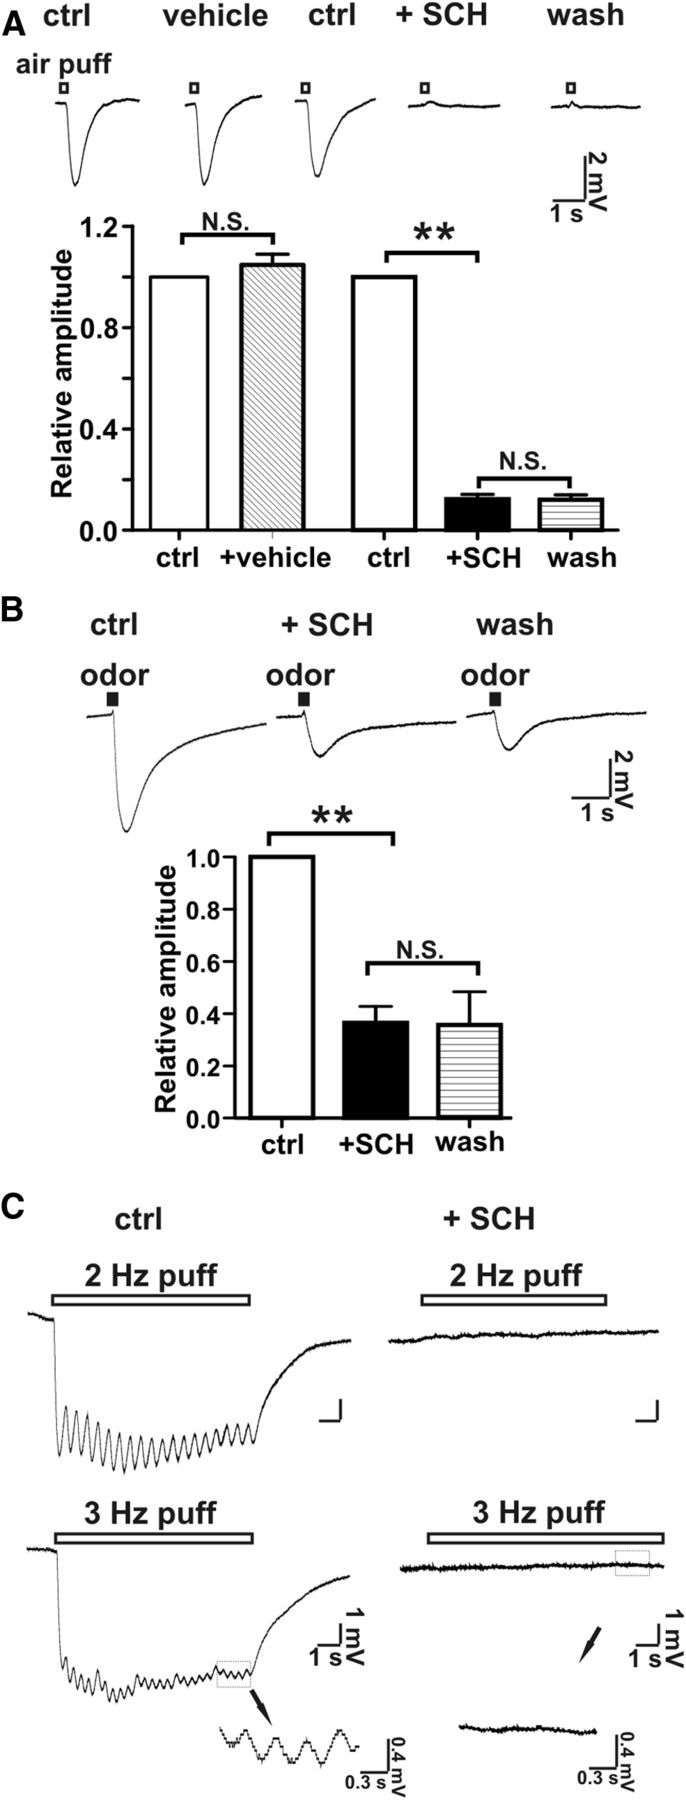
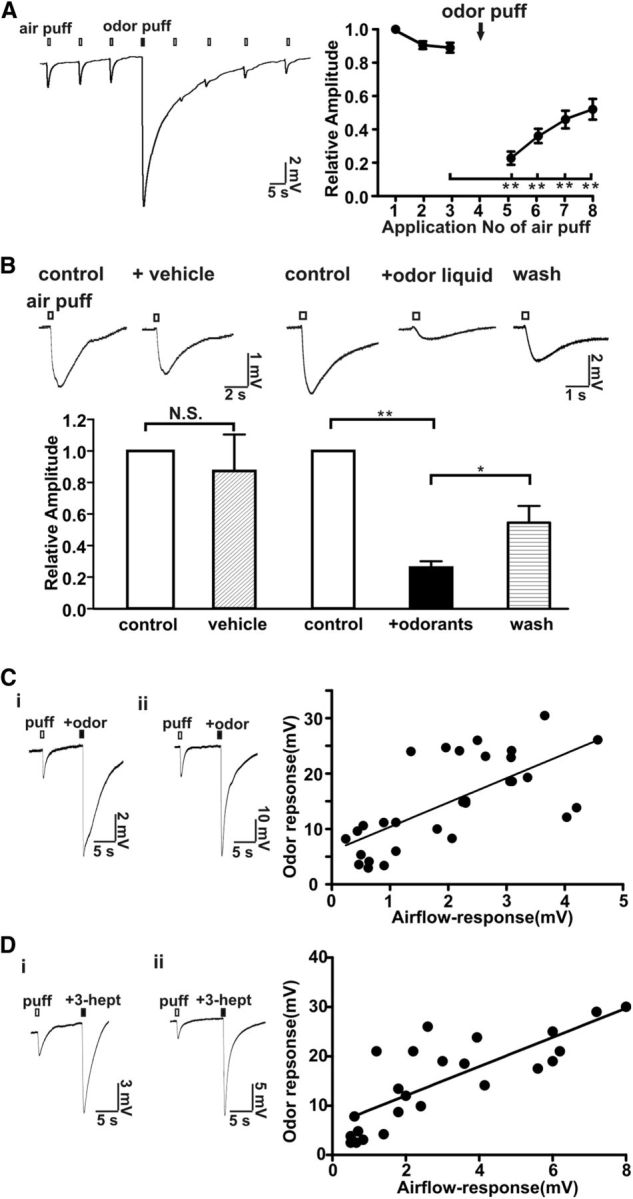
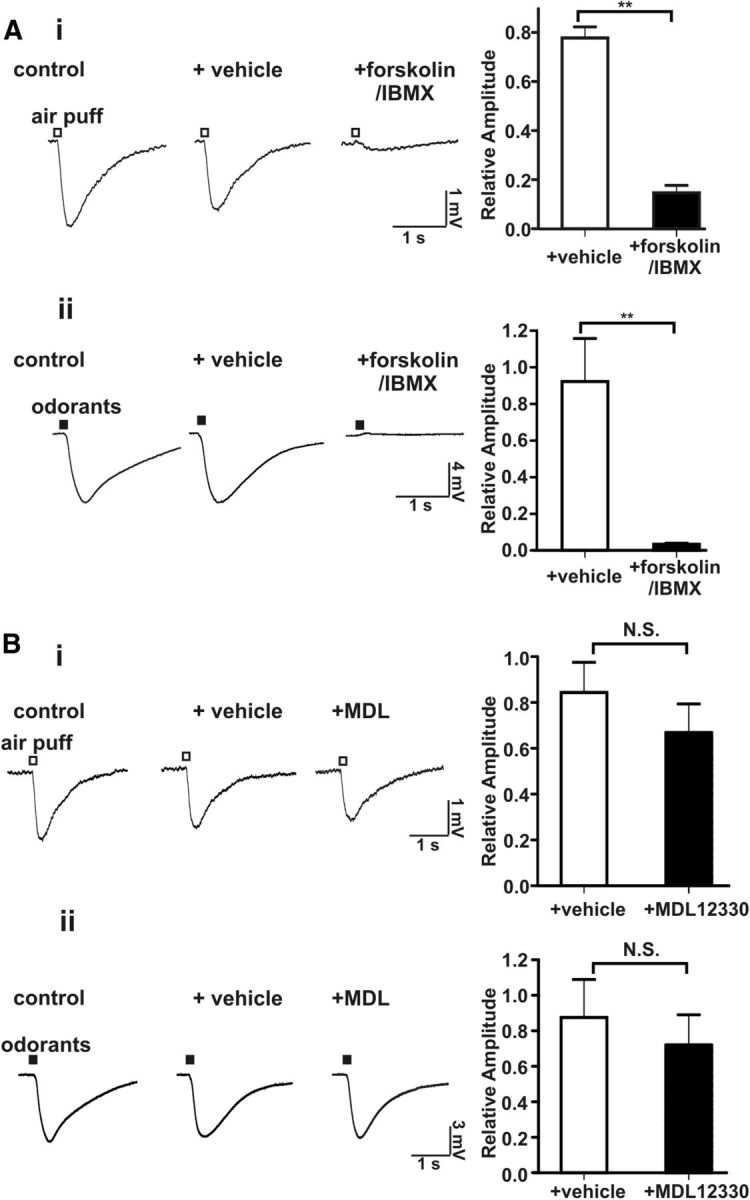
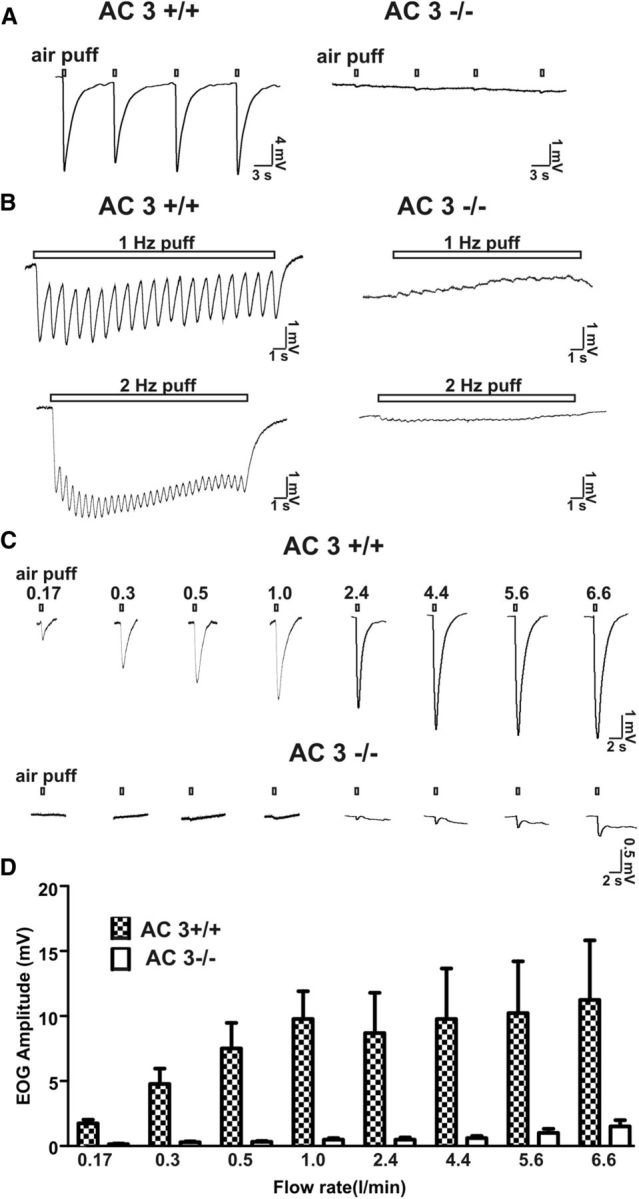
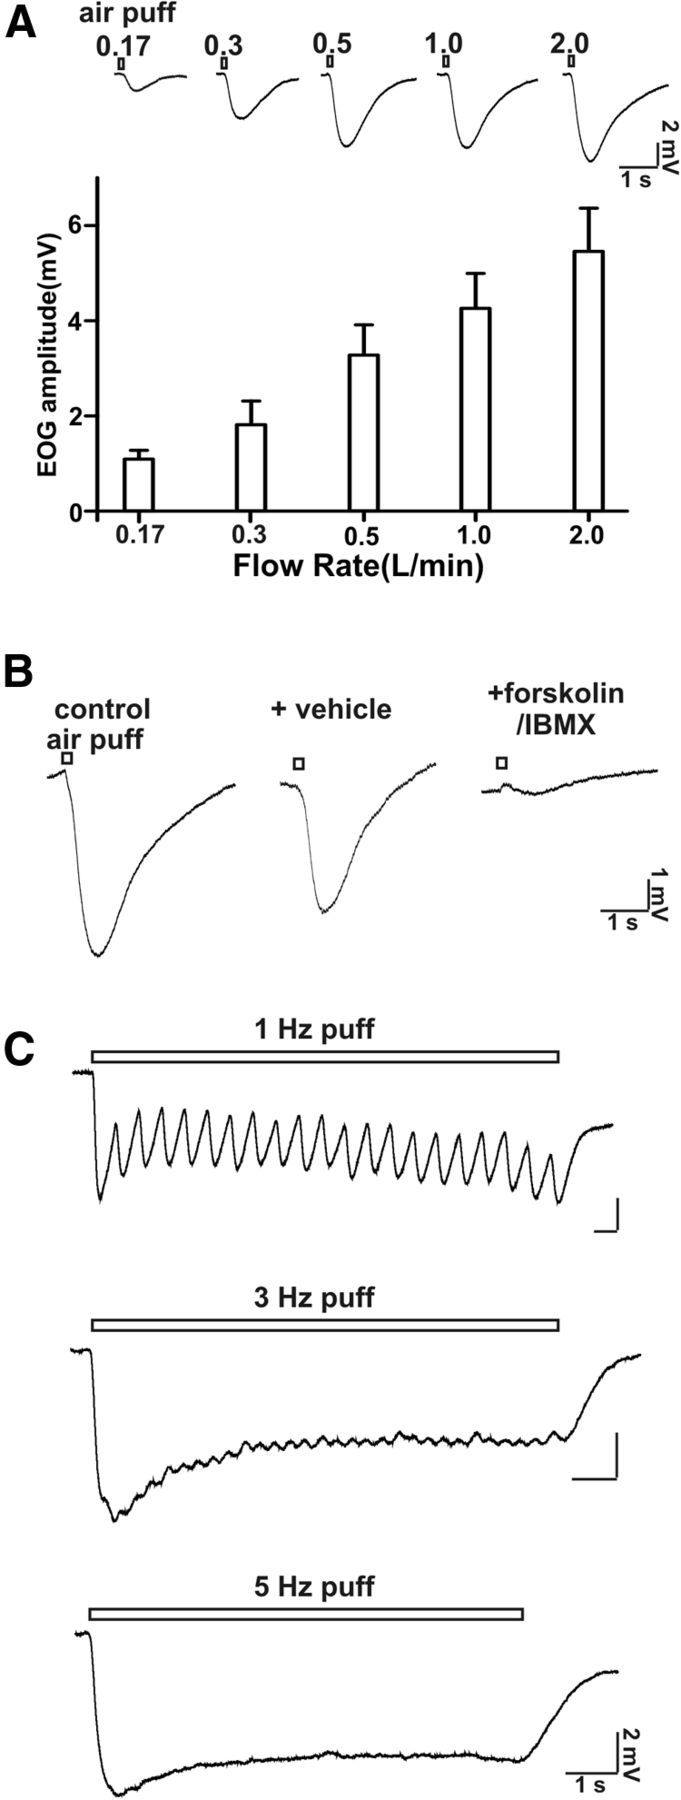
Cilia of olfactory sensory neurons are the primary sensory organelles for olfaction. The detection of odorants by the main olfactory epithelium (MOE) depends on coupling of odorant receptors to the type 3 adenylyl cyclase (AC3) in olfactory cilia. We monitored the effect of airflow on electro-olfactogram (EOG) responses and found that the MOE of mice can sense mechanical forces generated by airflow. The airflow-sensitive EOG response in the MOE was attenuated when cAMP was increased by odorants or by forskolin suggesting a common mechanism for airflow and odorant detection. In addition, the sensitivity to airflow was significantly impaired in the MOE from AC3(-/-) mice. We conclude that AC3 in the MOE is required for detecting the mechanical force of airflow, which in turn may regulate odorant perception during sniffing.


Figures

Figure 1.
Figure 1.
Mouse EOG responses to airflow. A, MOE (n = 13, middle of turbinate I), but not RE (n = 8) in nasal cavity, respond to airflow stimulation. Left, Representative traces of airflow-evoked responses (flow rate: 1 L/min). Right, Statistical data of field potential. **p < 0.01, t test. B, Representative traces of airflow-sensitive EOG responses in the middle of turbinate II evoked by air puffs (2.4 L/min) of varying duration. Left, Four representative EOG responses to air puffs varying in duration from 0.2 to 2 s. The desensitization and deactivation phases of the EOG responses were fitted with mono-exponential functions. Fitting curves were aligned with the original traces: dash curve was for deactivation and black curve was for desensitization. A rebound field potential (arrow) was observed in the 2 s air-puff stimulation. Right, Bar graphs for desensitization and deactivation time constants. C, Effects of repetitive air puffs on the airflow-sensitive EOG response. Left, Representative traces of airflow-stimulated response at interstimulation intervals of 10 s (n = 7) and 2 s (n = 6). Right, Plot of data. EOG voltage amplitude was normalized to the amplitude of the first puff stimulation. The airflow-sensitive responses had fast adaptation with 2 s and slow with 10 s stimulation intervals. **p < 0.01, one-way ANOVA test. Adaptation is one way to distinguish airflow-sensitive response from artifacts that do not show adaptation. D, Recovery kinetics of the airflow-sensitive EOG response. Airflow-sensitive response was evoked twice by air puff with various interstimulation intervals. Left, Superimposed representative traces of EOG recording (top, 0.35 L/min; bottom, 2.4 L/min). Right, Amplitude of airflow-sensitive signal of the second test was normalized to that of the first. Recovery percentage was plotted against stimulation interval and fitted with a mono-exponential function, yielding a recovery time constant of 1.6 s (0.35 L/min, n = 6) and 2.6 s (2.4 L/min flow rate, n = 9). With 2.4 L/min flow rate, maximal recovery (plateau) was 78%. E, Field potential amplitude of airflow-sensitive response (2.4 L/min) at turbinates I, II, III, and IV in the MOE. D, dorsal; M, middle; V, ventral.
Figure 2.
Figure 2.
Threshold for activation and EC50 for the EOG airflow-sensitive response. A, Determination of the threshold for airflow activation. Representative EOG traces from one recording site. A flow rate of 0.06 L/min, but not of 0.03 L/min, stimulated an airflow-sensitive response; puff duration: 200 ms, n = 6. B, EOG traces at different airflow rates up to 2.22 L/min are shown. Right, Plot of airflow-sensitive responses (amplitude normalized to the maximum) versus flow rate. Dose–response data were fitted with the Hill function (dash line). The EC50 was 0.62 ± 0.08 L/min (n = 8) with a Hill coefficient of 2.2 ± 0.3 (n = 8). C, The rise time for activation (20–80%) (left) and half-width of the airflow-sensitive response (right) at various flow rates.
Figure 3.
Figure 3.
Puff frequency-dependent airflow-sensitive EOG responses. A, Varying flow rate (0.17, 0.35, and 0.5 L/min, respectively) and several frequencies (1, 2, 3, 4, and 8 Hz, respectively) of air puff were used to stimulate MOE. Representative traces are shown. Puff duration: 50 ms; n = 5–9. B, High-frequency air-puff stimulation induced both EOG response and oscillation of the response. Shown are representative EOG traces stimulated with 2, 3, 5, and 8 Hz air puff. Flow rate: 0.5 L/min; puff duration: 50 ms; n = 4–7. Oscillations of airflow-sensitive EOG responses in phase with stimulating air puff are enlarged on the right.
Figure 4.
Figure 4.
SCH202676, an inhibitor of G-protein-coupled receptors inhibited airflow-sensitive and odor-stimulated responses. A, SCH202676 at 100 μm completely inhibited the airflow-sensitive response generated by an airflow of 2.4 L/min. Top, Representative EOG traces of the airflow-sensitive response. Bottom, Bar graph of data; n = 13, **p < 0.01. B, SCH202676 at 100 μm partially inhibited the EOG odor response. The EOG odor response was evoked by an air puff (2.4 L/min; puff duration, 200 ms) containing an odorant mix. Top, Representative EOG traces of odor response. Bottom, Bar graph of data; n = 7; **p < 0.01. Neither inhibition (airflow response or odor response) by SCH202676 was reversible. C, SCH202676 abolished the oscillation of the EOG response at 2 and 3 Hz air puff (pure N2)-induced EOG field potentials. Left, Control. Right, Addition of SCH202676 (100 μm). Bottom inset, Enlarged traces showing that oscillations of EOG response was abolished in the presence of SCH202676. Flow rate: 0.5 L/min; air-puff duration: 200 ms; n = 7.
Figure 5.
Figure 5.
Odorants reversibly desensitized the MOE to airflow. A, Application of an odorant mix applied via air puff (2.4 L/min, 200 ms) reversibly desensitized the airflow-sensitive response. Left, Representative trace of EOG responses. Right, Plot of normalized airflow-sensitive response versus application of the air puff; n = 12, **p < 0.01 (before odor stimulation vs after odor stimulation). B, A liquid odorant mix directly applied to the MOE reversibly inhibited the airflow-sensitive EOG response (2.4 L/min for 200 ms). The vehicle for the odorant mix did not change the airflow response. Washes with Ringer's solution partially reversed the inhibitory effect of the odorant solution. Top, Representative traces. Bottom, Bar graph of data; n = 8, **p < 0.01; *p < 005, paired Student's t test. C, D, Correlation between airflow-sensitive and odorant responses. The airflow-sensitive EOG response was first examined using an air puff (2.4 L/min, 200 ms) and then the odorant mixture was applied by air puff (2.4 L/min, 200 ms) using a mixture of odorants (see Materials and Methods; 50 μm each; C) or using a single odorant, 3-heptanone (500 μm; D) applied to the same location. Left, Two representative EOG traces recording in the MOE showing both airflow and odor responses. Note the y-axis scale bar distinctions. Right, Scatter plot of odor response versus airflow-sensitive response obtained from 27 different mice (C) or from 16 different mice (D). The linear equations obtained by linear regression were Y = 4.4 * X + 6.6 (C) and Y = 2.9 * X + 6.1 (D); Pearson test of correlation analysis: p < 0.001 (two-tailed), both C and D; r = 0.7 (C) and r = 0.86 (D).
Figure 6.
Figure 6.
Activation of adenylyl cyclase by forskolin inhibited the airflow-sensitive EOG response in the MOE. A, The airflow- and odorant-sensitive EOG responses were abolished by addition of forskolin (50 μm) with IBMX (60 μm) to the MOE. Left, Representative EOG traces of airflow-sensitive (i, n = 11) and odor (ii, n = 6) response. Right, Bar graph of data; **p < 0.01. B, The airflow- and odorant-sensitive EOG responses were unaffected by MDL12330A, an inhibitor of adenosine receptors. Left, Representative EOG traces of airflow-sensitive (i, n = 8) and odor response (ii, n = 7); Right, Bar graph of data.
Figure 7.
Figure 7.
Air puffs failed to stimulate an airflow-sensitive EOG response in AC3−/− mice. A, Representative EOG traces stimulated by single air puffs (2.4 L/min for 200 ms) to the MOE of AC3+/+ (n = 12) and from AC3−/− mice (n = 8). B, AC3−/− mice also failed to display oscillation as well as downward EOG response upon 1 and 2 Hz air-puff stimulations. Flow rate: 0.5 L/min; puff duration: 200 ms. C, EOG responses of AC3+/+ and AC3−/− MOE (exemplar traces are from two wild-type and two knock-out mice) to air puffs of varying flow rates. D, Bar graph for flow rate-dependent airflow-sensitive responses for AC3+/+ (n = 9) and AC3−/− mice (n = 9).
Figure 8.
Figure 8.
Rat MOE is sensitive to airflow stimulation. A, Top, EOG traces at different airflow rates up to 2 L/min are shown. Bottom, Bar graph (EOG amplitude) of airflow-sensitive responses at various flow rates. Recording site: middle of turbinate II; puff duration: 200 ms; n = 6–9. B, The airflow-sensitive response was abolished by application of forskolin (50 μm) and IMBX (60 μm). Flow rate: 0.5 L/min; puff duration: 200 ms; n = 6. C, High-frequency air-puff stimulation-induced oscillation of the airflow-sensitive response. Shown are representative EOG traces stimulated with 1, 3, and 5 Hz air puffs. Flow rate: 0.5 L/min; puff duration: 100 ms; n = 7.

Similar articles

Cited by

References

    1. Bakalyar HA, Reed RR. Identification of a specialized adenylyl cyclase that may mediate odorant detection. Science. 1990;250:1403–1406. - PubMed
    1. Boekhoff I, Inglese J, Schleicher S, Koch WJ, Lefkowitz RJ, Breer H. Olfactory desensitization requires membrane targeting of receptor kinase mediated by beta gamma-subunits of heterotrimeric G proteins. J Biol Chem. 1994;269:37–40. - PubMed
    1. Borisy FF, Ronnett GV, Cunningham AM, Juilfs D, Beavo J, Snyder SH. Calcium/calmodulin-activated phosphodiesterase expressed in olfactory receptor neurons. J Neurosci. 1992;12:915–923. - PMC - PubMed
    1. Carey RM, Wachowiak M. Effect of sniffing on the temporal structure of mitral/tufted cell output from the olfactory bulb. J Neurosci. 2011;31:10615–10626. - PMC - PubMed
    1. Fontanini A, Spano P, Bower JM. Ketamine-xylazine-induced slow (<1.5 Hz) oscillations in the rat piriform (olfactory) cortex are functionally correlated with respiration. J Neurosci. 2003;23:7993–8001. - PMC - PubMed

Publication types

LinkOut - more resources