. 2012 Nov 7;32(45):15791-801.
doi: 10.1523/JNEUROSCI.2598-12.2012.

Somatosensory projections to cochlear nucleus are upregulated after unilateral deafness

Affiliations

Somatosensory projections to cochlear nucleus are upregulated after unilateral deafness

Chunhua Zeng et al. J Neurosci. .

Abstract

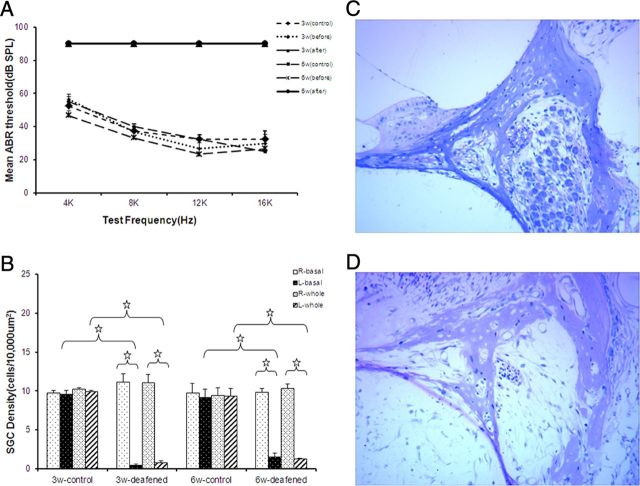
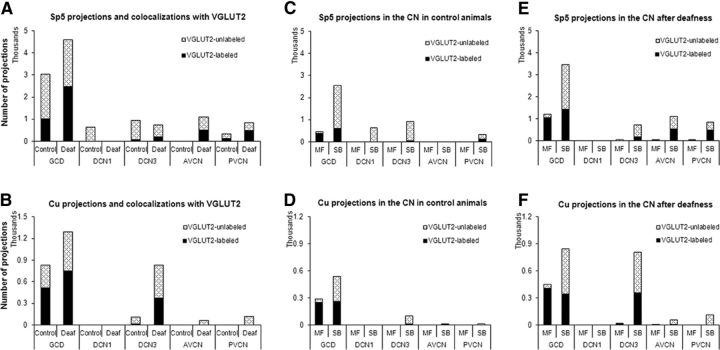
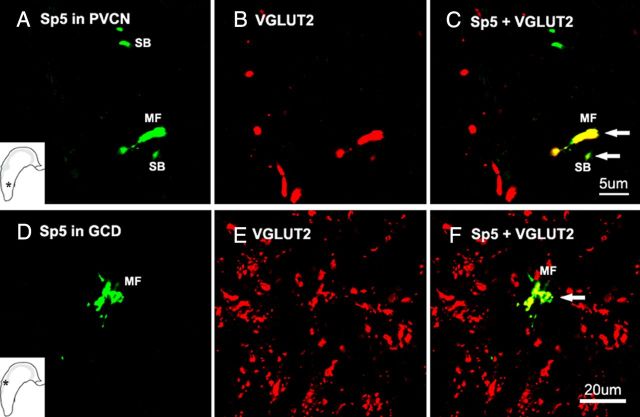
The cochlear nucleus (CN) receives innervation from auditory and somatosensory structures, which can be identified using vesicular glutamate transporters, VGLUT1 and VGLUT2. VGLUT1 is highly expressed in the magnocellular ventral CN (VCN), which receives auditory nerve inputs. VGLUT2 is predominantly expressed in the granule cell domain (GCD), which receives nonauditory inputs from somatosensory nuclei, including spinal trigeminal nucleus (Sp5) and cuneate nucleus (Cu). Two weeks after unilateral deafening VGLUT1 is significantly decreased in ipsilateral VCN while VGLUT2 is significantly increased in the ipsilateral GCD (Zeng et al., 2009), putatively reflecting decreased inputs from auditory nerve and increased inputs from nonauditory structures in guinea pigs. Here, we wished to determine whether the upregulation of VGLUT2 represents increases in the number of somatosensory projections to the CN that are maintained for longer periods of time. Thus, we examined concurrent changes in VGLUT levels and somatosensory projections in the CN using immunohistochemistry combined with anterograde tract tracing three and six weeks following unilateral deafening. The data reveal that unilateral deafness leads to increased numbers of VGLUT2-colabeled Sp5 and Cu projections to the ventral and dorsal CN. These findings suggest that Sp5 and Cu play significant and unique roles in cross-modal compensation and that, unlike after shorter term deafness, neurons in the magnocellular regions also participate in the compensation. The enhanced glutamatergic somatosensory projections to the CN may play a role in neural spontaneous hyperactivity associated with tinnitus.


Figures

Figure 1.
Figure 1.
A, Mean ABR thresholds for four normal control animals and for six animals three (N = 3) and six (N = 3) weeks following deafening by an injection of kanamycin into the left cochlea. ABRs on the left (ipsilateral) side are shown before and after deafening compared with the normal controls. ABRs indicate profound deafness in the left ears at both three and six weeks after kanamycin injections. No significant effect of the kanamycin injections was observed in any of the right ears. The black lines at 90 dB indicate no response at the limit of the speaker. B, Spiral ganglion counts for the whole cochlea as well as the basal turn are shown for four normal control animals and for six deafened animals, three (N = 3) and six (N = 3) weeks after kanamycin injections into the cochlea. The left side for the whole cochlea and the basal turn shows a noticeable loss when compared with the right side and normal controls (p < 0.01, open stars). Error bars represent SEM. C, Normal appearance of spiral ganglion cells in one control animal. D, Significant loss of spiral ganglion cells in one animal after three weeks of deafness.
Figure 2.
Figure 2.
VGLUT1 immunostaining is decreased in the magnocellular regions of AVCN and PVCN after deafness. Photomicrographs of VGLUT1 are taken from the AVCN and PVCN of one animal (three weeks after deafening). VGLUT1 is intensely expressed in AVCN (A) and PVCN (B) in the contralateral side as shown previously (Zhou et al., 2007; Zeng et al., 2009), but weakly expressed following deafening (C, D).
Figure 3.
Figure 3.
Mean VGLUT1 puncta densities in each CN subdivision in the ipsilateral side and contralateral side (N = 3 for each deafened animal group), as well as normal control CNs (N = 4 for each control group). VGLUT1 puncta densities (expressed as thousands/square mm) are significantly decreased in the ipsilateral AVCN and PVCN, compared with both the contralateral and normal control CNs (p < 0.0001, filled stars). Error bars represent SEM.
Figure 4.
Figure 4.
VGLUT2 immunostaining is increased in ipsilateral GCD and magnocellular regions (AVCN and PVCN) after unilateral deafness. (A, D) Photomicrographs of VGLUT2 from the GCD of one animal three weeks after deafening. VGLUT2 is increased in the ipsilateral GCD (A) compared with the contralateral side (D). B, C, E, F, Photomicrographs of VGLUT2 from the AVCN and PVCN of one animal three weeks after deafening. VGLUT2 is increased in the ipsilateral AVCN (B) and PVCN (C) compared with the contralateral AVCN (E) and PVCN (F).
Figure 5.
Figure 5.
Mean VGLUT2 puncta densities in each CN subdivision in the ipsilateral side and contralateral side (N = 3 for each deafened animal group), as well as normal control CNs (N = 4 for each control group). VGLUT2 puncta densities (expressed as thousands/square mm) are significantly increased in the ipsilateral GCD that receives nonauditory synaptic terminals (Zhou et al., 2007). VGLUT2 puncta densities are also significantly increased in ipsilateral magnocellular regions (AVCN and PVCN), which also receive some nonauditory inputs from Sp5 and cuneate nucleus (Zeng et al., 2011), compared with both the contralateral and normal control CNs (p < 0.05, filled stars). Error bars represent SEM.
Figure 6.
Figure 6.
Locations of the injection sites in matched control and deafened animals are shown on drawings of caudal to rostral transverse brainstem sections. The cross-hatched areas represent the injection sites in control guinea pigs, the solid shaded areas represent the injection sites in deafened guinea pigs. A, Three serial sections of matched pairs of Sp5 injections in one control animal (solid; volume = 3.56 mm3) and one deafened animal (hatched, volume = 2.81 mm3). B, A second pair of matched Sp5 injections in one control animal (solid; volume = 2.19 mm3) and one deafened animal (hatched; volume = 1.26 mm3). C, Matched Cu injections in one control animal (solid; volume = 0.49 mm3) and one deafened animal (hatched; volume = 0.44 mm3). D, A second matched pair of Cu injections in one control animal (solid; volume = 0.67 mm3) and one deafened animal (hatched; volume = 0.68 mm3). The injection sizes in two control animals with Sp5 injections are slightly larger than the matched deafened counterparts, while two pairs with Cu injections have very similar injection sizes. All injections occurred on the left side of the brain but are shown here for convenience of separation on both sides. sp5, Spinal trigeminal tract; Sp5I, pars interpolaris of Sp5; Sp5C, pars caudalis of Sp5; icp, inferior cerebellar peduncle; Gr, gracile nucleus.
Figure 7.
Figure 7.
Means and SEs of the means for Cu and Sp5 terminal endings in different subdivisions of the CN in control (Cu, N = 2; Sp5, N = 2) and deafened (Cu, N = 2; Sp5, N = 2) guinea pigs. There was little variation in the amount of CN labeling between control and deafened animals. A, Sp5 terminals were mostly located in the GCD, with increases seen in the GCD and VCN in the deafened animals. B, Cu terminal endings were mostly located in the GCD, with increases seen in the GCD and DCN3 in deafened animals.
Figure 8.
Figure 8.
Counts of labeled Cu and Sp5 terminal endings colocalized and not colocalized with VGLUT2 in different subdivisions of the CN in control (Cu, N = 2; Sp5, N = 2) and deafened (Cu, N = 2; Sp5, N = 2) guinea pigs. A, VGLUT2-labeled Sp5 terminals were mostly located in the GCD, with increases seen in the GCD and VCN in the deafened animals. B, VGLUT2-labeled Cu terminal endings were mostly located in the GCD, with increases seen in the GCD and DCN3 in deafened animals. C, E, VGLUT2-labeled Sp5 MFs and SBs significantly increased in the GCD and VCN in the deafened animals. D, F, Numbers of VGLUT2-labeled Cu MFs and SBs significantly increased in the GCD and DCN3 in deafened guinea pigs, some VGLUT2-labeled MFs were seen in the VCN.
Figure 9.
Figure 9.
High-magnification confocal images (×100) showing colocalization of anterogradely labeled Cu terminal endings with VGLUT2 in DCN3 (A–C) and GCD (D–F) in a 3-week-deafened guinea pig, the terminal locations are designated by the asterisks in the insets. A and D show BDA-labeled Cu terminals (green), B and E show VGLUT2 labeling (red). Colocalization of VGLUT2 with Cu SBs in DCN3 is shown by arrows in C, and colocalization of VGLUT2 with Cu MFs in GCD is shown by arrow in F. Scale bars: A–C, 5 μm; D–F, 20 μm.
Figure 10.
Figure 10.
High-magnification confocal images (×100) showing colocalization of anterogradely labeled Sp5 terminal endings with VGLUT2 in PVCN (A–C) and GCD (D–F) in a 3-week-deafened guinea pig, the terminal locations are designated by the asterisks in the insets. A and D show BDA-labeled Sp5 terminals (green), B and E show VGLUT2 labeling (red). Colocalization of VGLUT2 with Sp5 SBs and MFs in PVCN is shown by arrows in C, and colocalization of VGLUT2 with Sp5 MFs in GCD is shown by arrow in F. Scale bars: A–C, 5 μm; D–F, 20 μm.
Figure 11.
Figure 11.
Counts of labeled Cu and Sp5 terminal endings colocalized with VGLUT1 in different subdivisions of the CN in control (Cu, N = 2; Sp5, N = 2) and deafened (Cu, N = 2; Sp5, N = 2) guinea pigs. A, B, Only a few Cu and Sp5 terminals colabeled with VGLUT1. These terminals were mostly located in the GCD in both control and deafened guinea pigs. C, E, Numbers of VGLUT1-labeled Sp5 MFs significantly increased in the GCD following three week unilateral deafening. D, F, Numbers of VGLUT1-labeled Cu MFs significantly increased in the GCD following three week unilateral deafening.

Similar articles

Cited by

References

    1. Abercrombie M. Estimation of nuclear population from microtome sections. Anat Rec. 1946;94:239–247. - PubMed
    1. Barker M, Solinski HJ, Hashimoto H, Tagoe T, Pilati N, Hamann M. Acoustic overexposure increases the expression of VGLUT-2 mediated projections from the lateral vestibular nucleus to the dorsal cochlear nucleus. PLoS One. 2012;7:e35955. - PMC - PubMed
    1. Bauer CA, Brozoski TJ, Myers K. Primary afferent dendrite degeneration as a cause of tinnitus. J Neurosci Res. 2007;85:1489–1498. - PubMed
    1. Benson CG, Gross JS, Suneja SK, Potashner SJ. Synaptophysin immunoreactivity in the cochlear nucleus after unilateral cochlear or ossicular removal. Synapse. 1997;25:243–257. - PubMed
    1. Brozoski TJ, Bauer CA. The effect of dorsal cochlear nucleus ablation on tinnitus in rats. Hear Res. 2005;206:227–236. - PubMed

Publication types

MeSH terms

Substances

LinkOut - more resources