. 2012 Nov 7;32(45):15983-97.
doi: 10.1523/JNEUROSCI.6282-11.2012.

Membrane-proximal tryptophans of synaptobrevin II stabilize priming of secretory vesicles

Affiliations

Membrane-proximal tryptophans of synaptobrevin II stabilize priming of secretory vesicles

Maria Borisovska et al. J Neurosci. .

Abstract

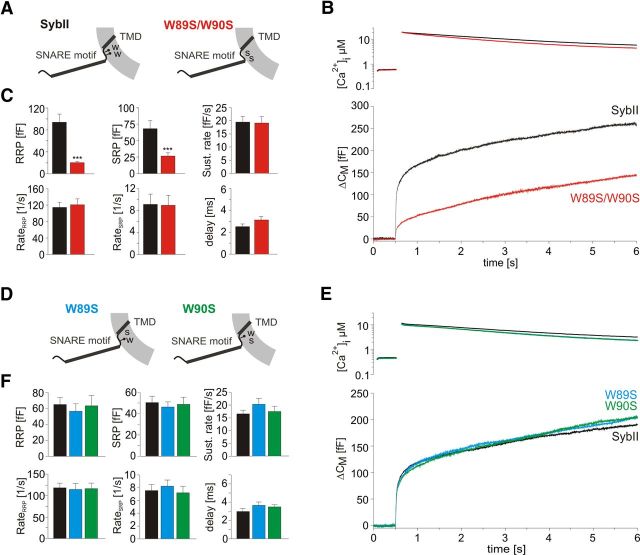
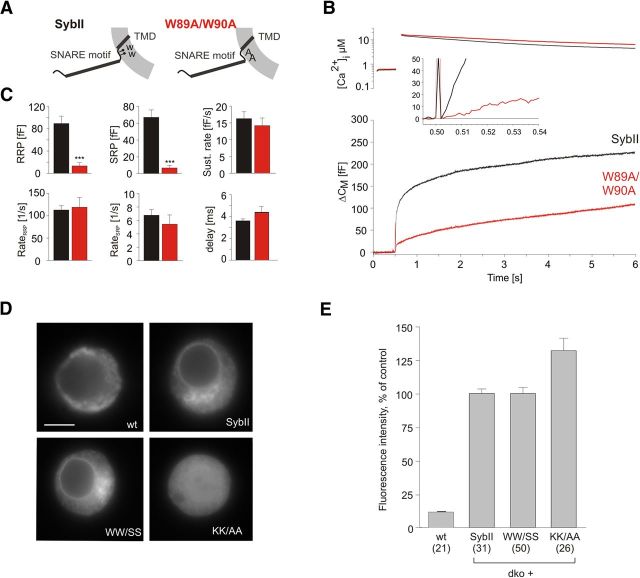
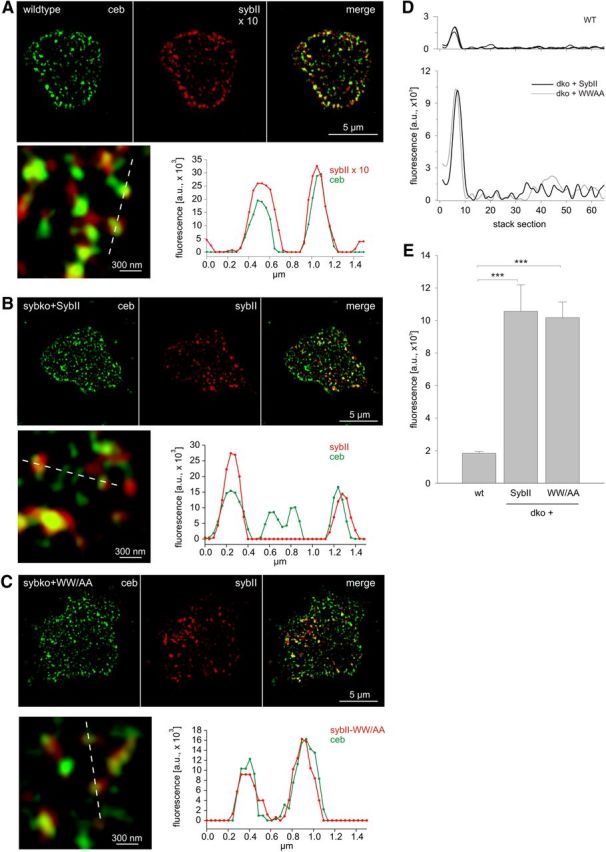
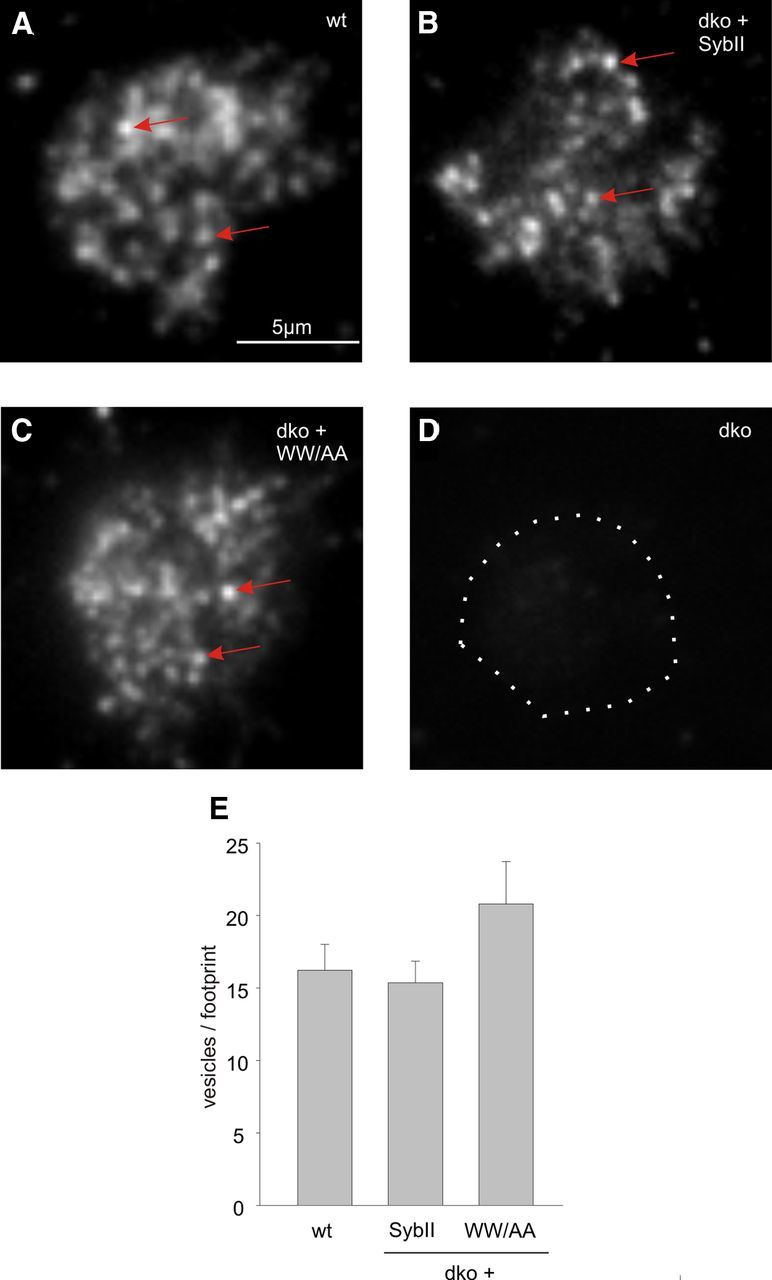
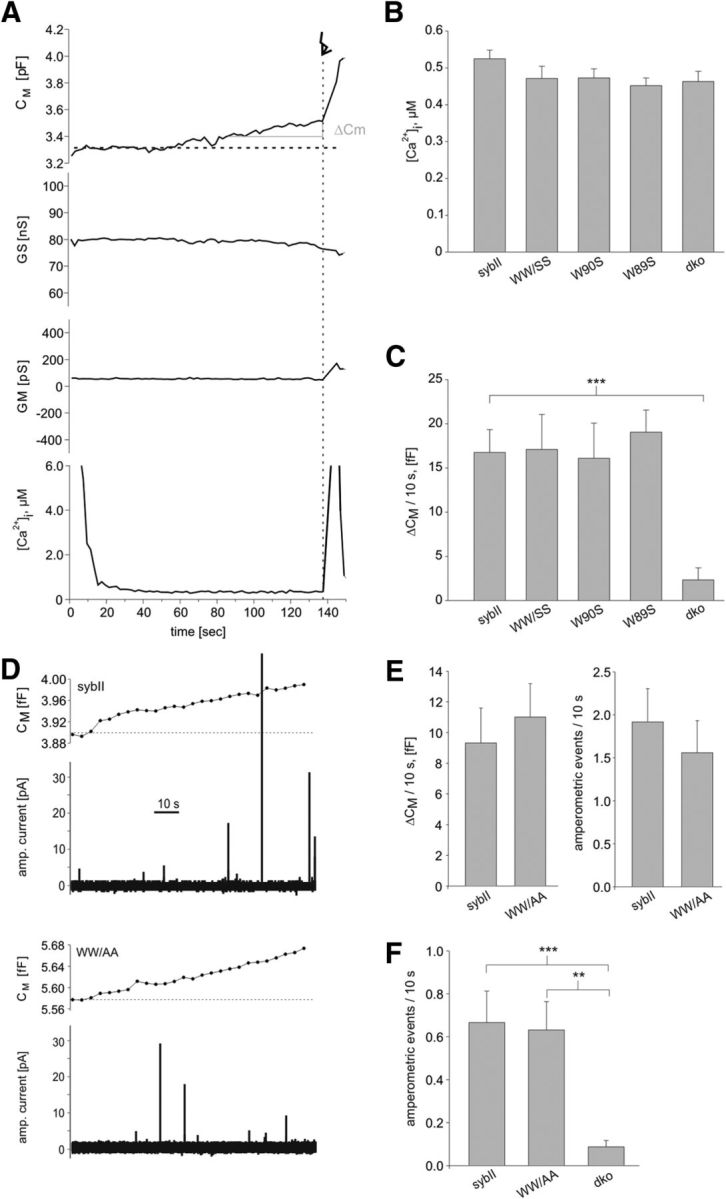
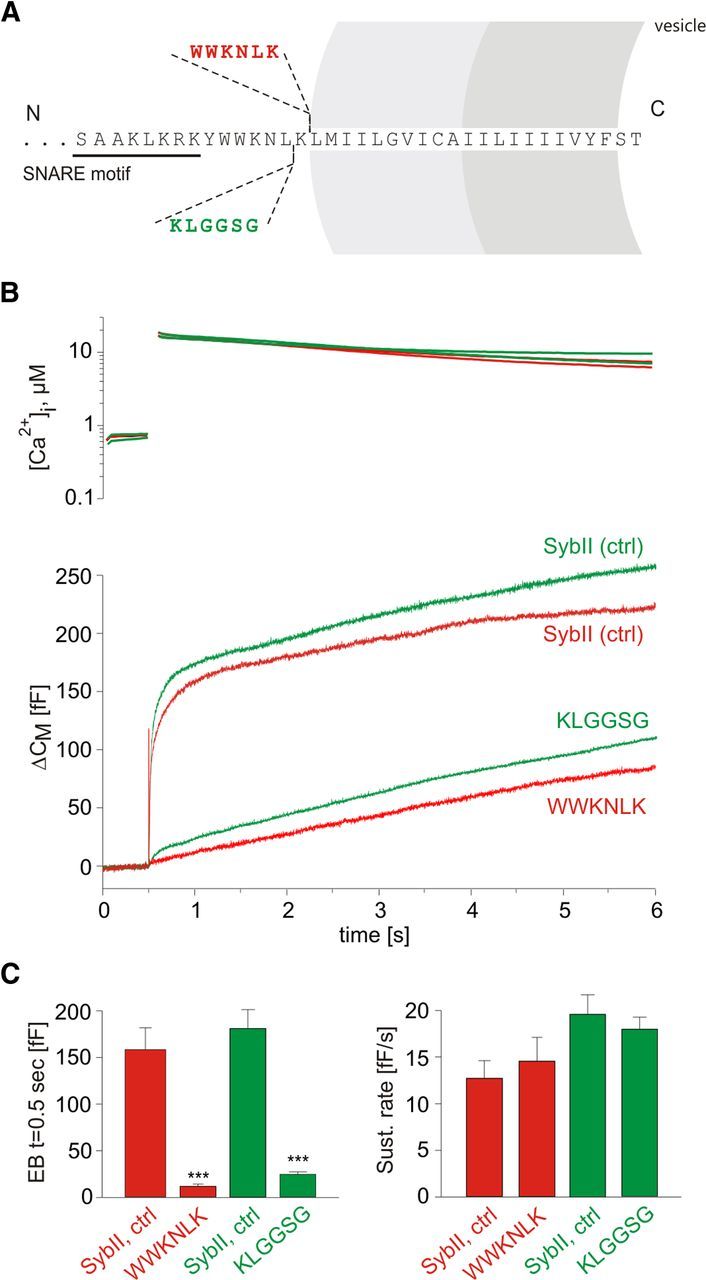
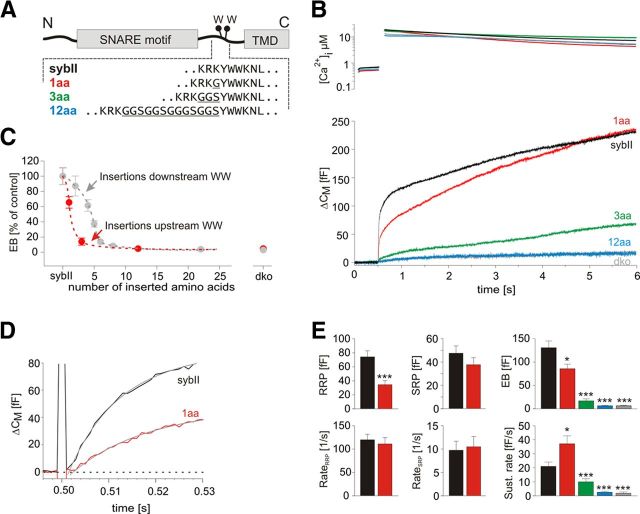
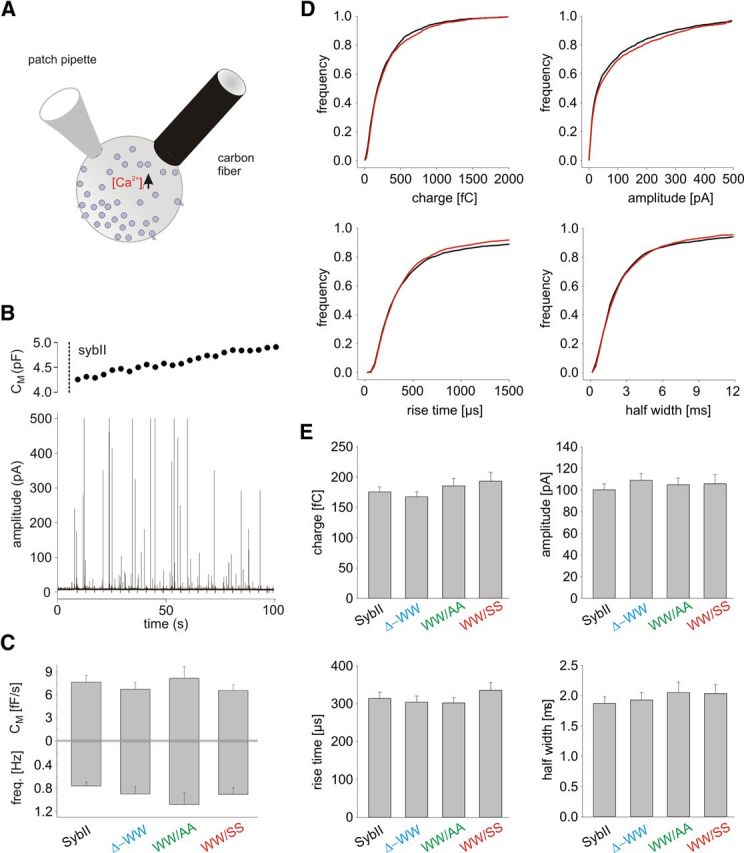
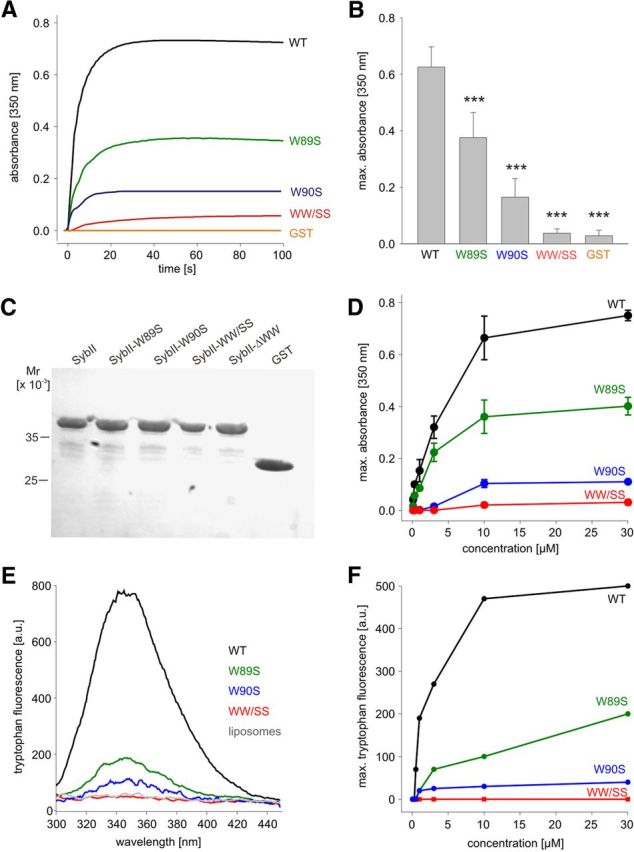
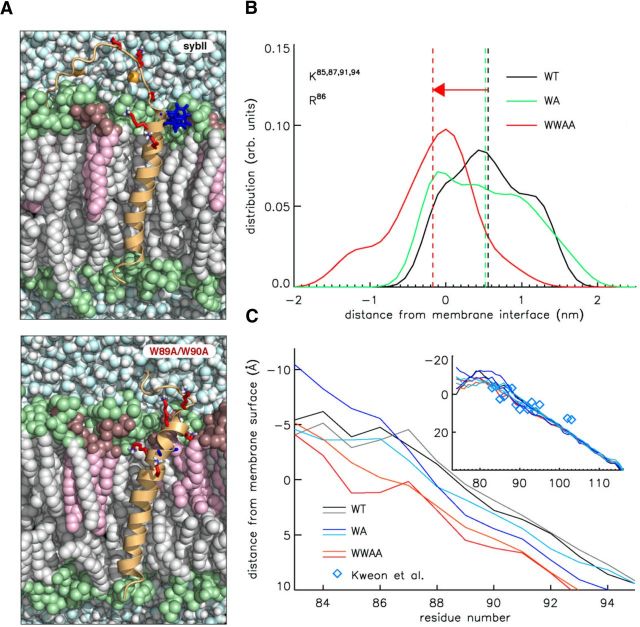
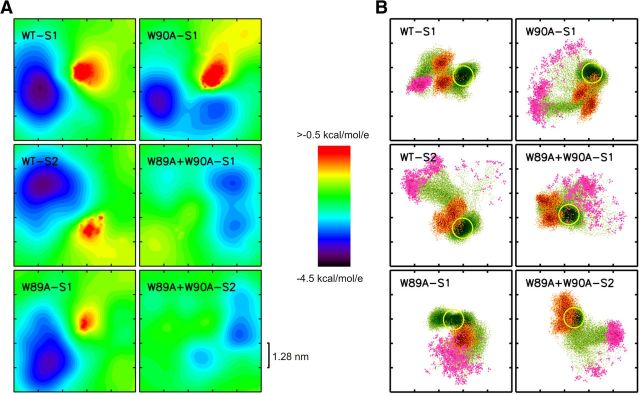
Trans-soluble N-ethylmaleimide-sensitive factor attachment protein (SNAP) receptor (SNARE) complexes formed between the SNARE motifs of synaptobrevin II, SNAP-25, and syntaxin play an essential role in Ca(2+)-regulated exocytosis. Apart from the well studied interactions of the SNARE domains, little is known about the functional relevance of other evolutionarily conserved structures in the SNARE proteins. Here, we show that substitution of two highly conserved tryptophan residues within the juxtamembrane domain (JMD) of the vesicular SNARE Synaptobrevin II (SybII) profoundly impairs priming of granules in mouse chromaffin cells without altering catecholamine release from single vesicles. Using molecular dynamic simulations of membrane-embedded SybII, we show that Trp residues of the JMD influence the electrostatic surface potential by controlling the position of neighboring lysine and arginine residues at the membrane-water interface. Our observations indicate a decisive role of the tryptophan moiety of SybII in keeping the vesicles in the release-ready state and support a model wherein tryptophan-mediated protein-lipid interactions assist in bridging the apposing membranes before fusion.


Figures

Figure 1.
Figure 1.
Membrane-proximal tryptophan residues are important for vesicle priming. A, Schematic representation of SybII and its WW/SS mutant (W89S, W90S) on the vesicular membrane. B, Averaged flash-induced [Ca2+]i levels (top panel) and corresponding capacitance responses (bottom panel) of dko cells expressing SybII (black; n = 21) or the WW/SS variant (red; n = 20). C, The analysis of individual responses indicates a strong reduction of both pools of primed vesicles RRP and SRP, but no changes in their fusion kinetics in the absence of both tryptophan residues. D, Schematic representation of the single tryptophan mutations: W89S (left panel) and W90S (right panel). E, Averaged flash-induced [Ca2+]i levels (top panel) and corresponding capacitance responses (bottom panel) of dko cells expressing SybII (black; n = 20) or SybII variants with replaced W89S (blue; n = 21) or W90S (green; n = 21). F, The kinetic components of the secretory response remain unchanged for W89S and W90S. ***p < 0.001, one-way ANOVA. Error bars indicate SEM.
Figure 2.
Figure 2.
Substitution of membrane-proximal tryptophan residues with alanines also impairs vesicle priming. A, Schematic representation of synaptobrevin II W89A/W90A mutation. B, Averaged flash-induced [Ca2+]i levels (top panel) and corresponding capacitance responses (bottom panel) of dko cells expressing SybII (black; n = 23) or the WW/AA variant (orange; n = 17). The inset shows the extended scaling of the capacitance responses illustrating a similar onset of exocytosis after the stimulus (t = 0.5 s) for the mutant protein. C, The WW/AA mutant reduces the RRP and SRP pool size but leaves the kinetics of the exocytotic response unchanged. D, Exemplary images of a wild-type cell and dko cells overexpressing either sybII or mutated v-SNARE proteins. Immunosignals were detected with an affinity-purified monoclonal antibody (69.1) directed against the N terminus of sybII and are visualized after adjustment of the exposure time of the camera (wt, 1.2 s; dko + v-SNARE, 0.2 s). A mutant protein with K91A and K94A substitution (KK/AA) appears to be missorted, as judged from the homogenous distribution of the immunosignal. No exocytotic activity could be recorded with this mutant (data not shown). Scale bar, 5 μm. E, Average fluorescence intensity of wt cells and of dko cells expressing the indicated mutants or SybII. Note that expression of SybII or its mutants in dko cells leads to a 7- to 10-fold increase in protein level when compared with the wt signal. Data were normalized to the immunosignal of SybII expressed in dko cells. Numbers indicate analyzed cells. ***p < 0.001, one-way ANOVA. Error bars indicate SEM.
Figure 3.
Figure 3.
SybII and its TRP mutant are sorted to granules with similar efficiencies. Exemplary immunostainings (imaged with structured illumination microscopy) for Ceb (green) and SybII (red) in wild-type chromaffin cells (A) and Sybko cells expressing SybII (B) or the SybII-WWAA mutant protein (C). Cells were imaged within the footprint area to minimize the contribution of Golgi-derived fluorescence in virus-transfected cells. SybII fluorescence signals in wild-type cells were excited with fivefold higher laser power than in virus-transfected cells and were multiplied times 2 for display (×10). The merged images and their magnified view display a clear colocalization between Ceb and SybII (or the WWAA mutant), as also illustrated in the corresponding line scans (magnified view, dashed lines; pixel size, 40 nm). D, Exemplary fluorescence profiles of discrete SybII puncta analyzed by z-stacking through the cell. Note the different amplitudes of SybII puncta in wild-type (top panel, 3 exemplary traces) and virus-infected dko cells (bottom panel). E, The mean fluorescence intensity of single SybII puncta is similar for SybII and the WW/AA mutant and fivefold higher than in wild-type cells. For analysis, images were thresholded to values 6 SD of the background fluorescence to isolate discrete regions of interest (ROIs). On average, similar-sized ROIs in wild-type cells (0.0258 ± 0.0027 μm2; 10 cells; 1018 ROIs) and dko cells expressing SybII (0.0245 ± 0.0019 μm2; 7 cells; 250 ROIs) or the WW/AA mutant (0.0233 ± 0.0012 μm2; 12 cells; 365 ROIs) were analyzed. ***p < 0.001, one-way ANOVA. Error bars indicate SEM.
Figure 4.
Figure 4.
TRP mutant protein does not interfere with vesicle docking. A–C, Wild-type chromaffin cells and dko cells expressing either SybII or the WWAA mutant exhibit SybII-positive granules (exemplary granules, arrows) in the footprint of the cell visualized by evanescent illumination. D, No signals are observed in dko cells (dotted line, cell perimeter) indicating specificity of the antibody. E, The number of SybII-positive puncta is unchanged in WWAA mutant cells (n = 14) compared with SybII-expressing dko cells (n = 17) or wild-type cells (n = 9) (p = 0.314, one-way ANOVA). Error bars indicate SEM.
Figure 5.
Figure 5.
Loss of the TRP moiety in SybII does not unclamp exocytosis in chromaffin cells. A, Exemplary recording of cell membrane capacitance (Cm), access resistance (Gs), membrane resistance (Gm), and [Ca2+]i during infusion of submicromolar [Ca2+]i in a double ko cell expressing SybII. Note the shallow but steady increase in membrane capacitance (ΔCm) before the flash (arrow). The initial high [Ca] signal is due to Ca2+ indicators that leak out of the patch pipette approaching the cell. The signal is rapidly diminished due to indicator dilution after establishing cell contact and [Ca]i measurements were considered at t > 60 s. B, C, Quantification of [Ca2+]i and capacitance increase (ΔCM) over the last 10 s before flash stimulation. Note the SybII-dependent increase in ΔCM that is unchanged for the mutant proteins. Data were collected from dko cells (n = 22) and dko cells expressing SybII (n = 46), WW/SS mutant (n = 15), W89S (n = 21), W90S (n = 22). D, Measurements of membrane capacitance (top panels) and simultaneous amperometric recordings (bottom panels) from dko cells expressing sybII or the WW/AA mutant. t = 0, start of intracellular perfusion with Ca2+-containing solution (free [Ca2+]i = 350 nm) via the patch pipette. E, Both assays for secretion, membrane capacitance (left panel) and amperometry (right panel), reveal no differences between SybII (n = 22) and the WW/AA mutant (n = 22). F, Amperometric recordings in resting chromaffin cells reveals a v-SNARE-dependent increase in exocytotic activity that is similar in SybII- and WW/AA-expressing dko cells (SybII, n = 22; WW/AA, n = 25; dko, n = 8). **p < 0.005, ***p < 0.001, one-way ANOVA. Error bars indicate SEM.
Figure 6.
Figure 6.
Duplication of the intrinsic WWKNLK motif reveals a similar phenotype as observed for the KLGGSG insertion. A, Schematic view of SybII domains and the amino acid insertions within the JMD of SybII. B, Averaged flash-induced [Ca2+]i levels (top panel) and corresponding capacitance responses (bottom panel) of dko cells expressing SybII (control for WWKNLK, red, n = 19; control for KLGGSG, green, n = 25) or the mutant protein carrying either an extra WWKNLK motif (red; n = 17) or a KLGGSG insertion (green; n = 41). C, Quantification of the responses reveals similarly strong reduction of the exocytotic burst (measured 0.5 s after the flash) for either type of insertion. ***p < 0.001, one-way ANOVA. Error bars indicate SEM.
Figure 7.
Figure 7.
Amino acid insertions upstream of tryptophan residues produce a strong linker length-dependent reduction of the secretory response. A, Scheme depicts the mutations introduced into SybII. Inserted amino acids are underlined. B, Averaged flash-induced [Ca2+]i levels (top panel) and corresponding capacitance responses (bottom panel) of dko cells expressing wt SybII (black; n = 24) or mutated SybII variants, 1 aa (red; n = 21), 3 aa (green; n = 15), 12 aa (blue; n = 11). The 12 aa variant fails to support any release compared with dko (gray; n = 8). C, Comparison of the linker length-dependent reduction of the exocytotic burst size (measured at t = 0.5 s after the flash) for linkers positioned upstream (red) or downstream of the TRP residues [gray; data taken from the study by Kesavan et al. (2007)] of the tryptophan residues. D, Extended scaling of the capacitance responses for control and 1 aa mutant shown in B illustrates no changes in the exocytotic delay. The gray lines represent double exponential fit of the responses. E, Quantification obtained from fitting of each individual response indicates a steep decrease in the exocytotic burst size with increasing linker length. *p < 0.05, ***p < 0.001, one-way ANOVA. Error bars indicate SEM.
Figure 8.
Figure 8.
Catecholamine release from chromaffin granules is unchanged in TRP mutants. A, Schematic drawing of the experimental setup. B, Infusion of a dko cell expressing SybII (t = 5 s; cell opening; dashed line) with an intracellular solution containing 19 μm [Ca]i causes a barrage of exocytotic activity as documented by simultaneous amperometric and membrane capacitance recordings. C, Deletion (Δ−WW, n = 18) or substitution of the TRP residues (WW/AA, n = 15; WW/SS, n = 15) changes neither the amperometric event frequency nor the capacitance increase compared with SybII (n = 24). D, Comparison of amperometric spike properties recorded in SybII and WW/SS mutant protein expressing cells. Data are plotted as cumulative frequency distributions for the indicated parameters. E, Loss of the TRP moiety does not change quantal size, peak amplitude, or kinetics of single fusion events. Error bars indicate SEM.
Figure 9.
Figure 9.
The membrane-proximal tryptophans enable phospholipid binding of the cytoplasmic domain of SybII to synthetic liposomes. A, GST-SybII (1–96 aa; 10 μm; added at t = 0 s) cross-links liposomes, measured as absorbance increase at 350 nm. Single and double TRP mutants show impaired or nearly abolished cross-linking, respectively. Glutathione S-transferase served as control. B, Maximum absorbance increase measured at a concentration of 10 μm for SybII and its mutant variants. Data were collected from nine independent experiments. C, Coomassie-stained polyacrylamide/SDS gel shows the integrity of proteins used in the turbidity assay. Ten microliters of the turbidity assay were analyzed. D, Concentration dependence of absorbance increase for SybII and its mutants. E, Fluorescence emission spectra of tryptophan residues monitored upon mixing GST-SybII 1–96 (10 μm) or its mutant variants with liposomes. Neither protein-free liposomes (gray trace) nor the WW/SS mutant (red trace) displays any significant emission. Note that fluorescence emission increased strongly for the wild-type protein (black trace) but was significantly reduced for the single mutants (green and blue trace). F, Concentration dependence of maximal tryptophan fluorescence emission for GST-SybII and the mutant proteins in the presence of liposomes. The tryptophan emission was corrected for the corresponding protein emission at the given concentration. ***p < 0.001, one-way ANOVA. Error bars indicate SEM.
Figure 10.
Figure 10.
Increased insertion depth of the SybII WW/AA mutant. A, Two exemplary MD snapshots of the wild-type (SybII, top panel) and the double-mutated (W89A/W90A, bottom panel) SybII in a lipid bilayer. The protein is depicted in diagram representation. Selected amino acids are highlighted in stick representation: Lys (red), Trp and Ala89/90 in the double mutant (blue). Water molecules and lipids are drawn as balls. POPC lipids are depicted in gray (tail) and lime (head group region), and POPS molecules in pink (tail) and brown (head group). B, Distribution of basic residues with respect to the upper layer membrane surface for wild-type SybII and its mutant proteins. The graph reports the normalized (number) density of the atoms of the charged moieties of Lys85, 87, 91, 94 and of Arg86 as obtained from the MD simulations of the wild type (WT), the single mutants (WA), and the double mutant (WW/AA) Synaptobrevin II. The dashed lines indicate mean values of the corresponding frequency distribution. The densities are calculated considering the last 300 ns of each simulation, and data for the single mutants (W89, W90) were averaged. The “zero” on the x-axis represents the plane defined by the phosphorus atoms of the POPC and POPS lipids in the JMD proximal lipid leaflet. C, Residue-resolved mean distance of SybII backbone positions from the membrane-solvent interface. The inset shows the distance of simulated SybII residues as well as experimental data derived from EPR accessibility measurements (diamonds) (Kweon et al., 2003).
Figure 11.
Figure 11.
Electrostatic potential maps of the JMD proximal membrane surface. A, The electrostatic potential averaged over 300 structures (protein plus membrane) extracted every 1 ns from the MD trajectories (neglecting the first 100 ns) at a distance of ∼1.2 nm from the membrane interface (defined by the center of mass of the lipid head groups of the JMD proximal lipid leaflet). Calculations were restricted to the residues of the JMD and TMD (residues 86–116) to minimize effects that can be obtained from insufficient sampling of the N-terminal JMD region. WT-S1 and S2 as well as WW/AA S1 and S2 are independent simulations. B, Density map of SybII backbone atoms in the membrane plane, plotted to the same scale as in A. Shown are the positions of the SybII backbone atoms (green dots), of the (simulated) N terminus (Ala74; magenta), and of the lysine residues 83 and 85 (orange; side chain positions). The TMD position is indicated by a yellow circle. The location of the negative membrane potential largely correlates with the position of the N-terminal Ala74. Additionally, lysines 83 and 85 are oriented toward the N terminus of the JMD for the WT as well as for the single mutants, but are opposed for the double mutant.

Similar articles

Cited by

References

    1. Araç D, Chen X, Khant HA, Ubach J, Ludtke SJ, Kikkawa M, Johnson AE, Chiu W, Südhof TC, Rizo J. Close membrane-membrane proximity induced by Ca2+-dependent multivalent binding of synaptotagmin-1 to phospholipids. Nat Struct Mol Biol. 2006;13:209–217. - PubMed
    1. Ashery U, Betz A, Xu T, Brose N, Rettig J. An efficient method for infection of adrenal chromaffin cells using the Semliki Forest virus gene expression system. Eur J Cell Biol. 1999;78:525–532. - PubMed
    1. Augustine GJ, Neher E. Calcium requirements for secretion in bovine chromaffin cells. J Physiol. 1992;450:247–271. - PMC - PubMed
    1. Berendsen HJC, Postma JPM, Vangunsteren WF, Dinola A, Haak JR. Molecular dynamics with coupling to an external bath. J Chem Phys. 1984;81:3684–3690.
    1. Berger O, Edholm O, Jähnig F. Molecular dynamics simulations of a fluid bilayer of dipalmitoylphosphatidylcholine at full hydration, constant pressure, and constant temperature. Biophys J. 1997;72:2002–2013. - PMC - PubMed

Publication types

Substances

LinkOut - more resources