. 2012 Nov 7;32(45):16051-63.
doi: 10.1523/JNEUROSCI.1828-12.2012.

Long-term changes in trigeminal ganglionic and thalamic neuronal activities following inferior alveolar nerve transection in behaving rats

Affiliations

Long-term changes in trigeminal ganglionic and thalamic neuronal activities following inferior alveolar nerve transection in behaving rats

Wan-Ting Tseng et al. J Neurosci. .

Abstract

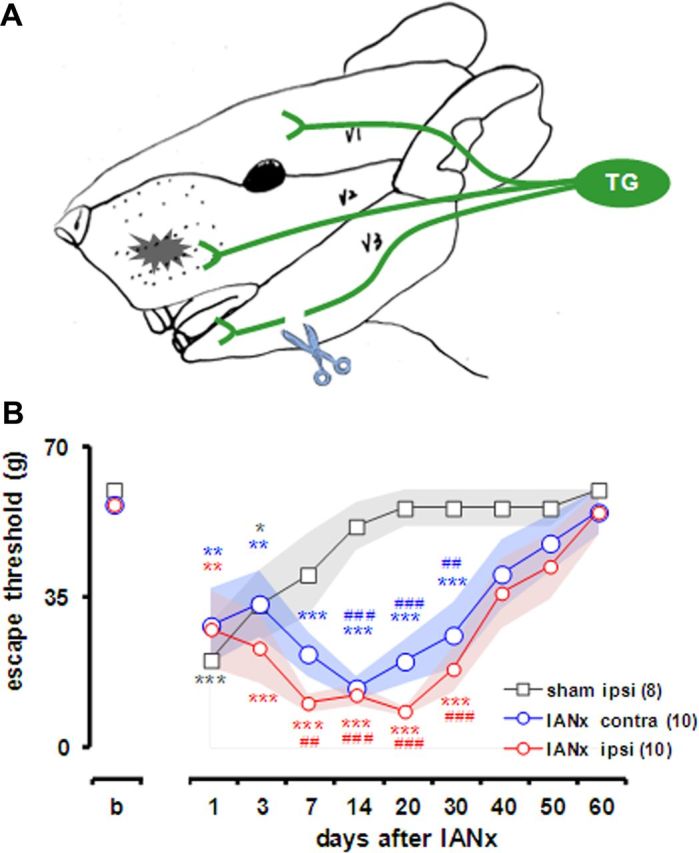
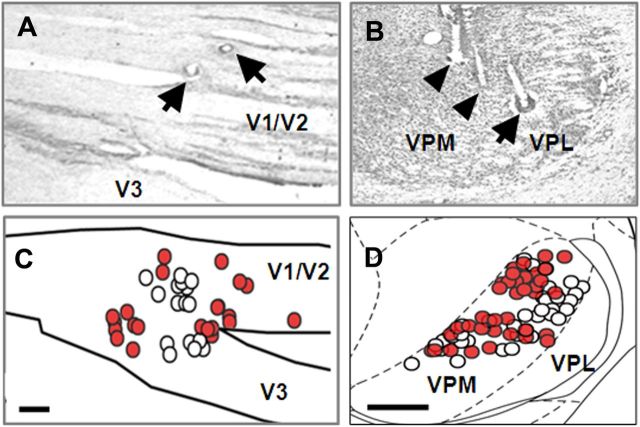
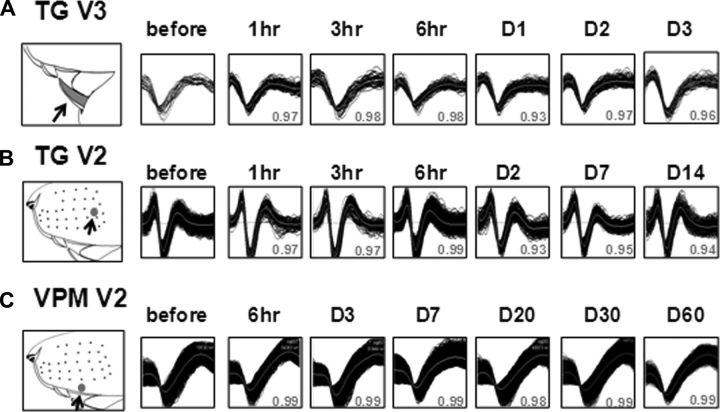
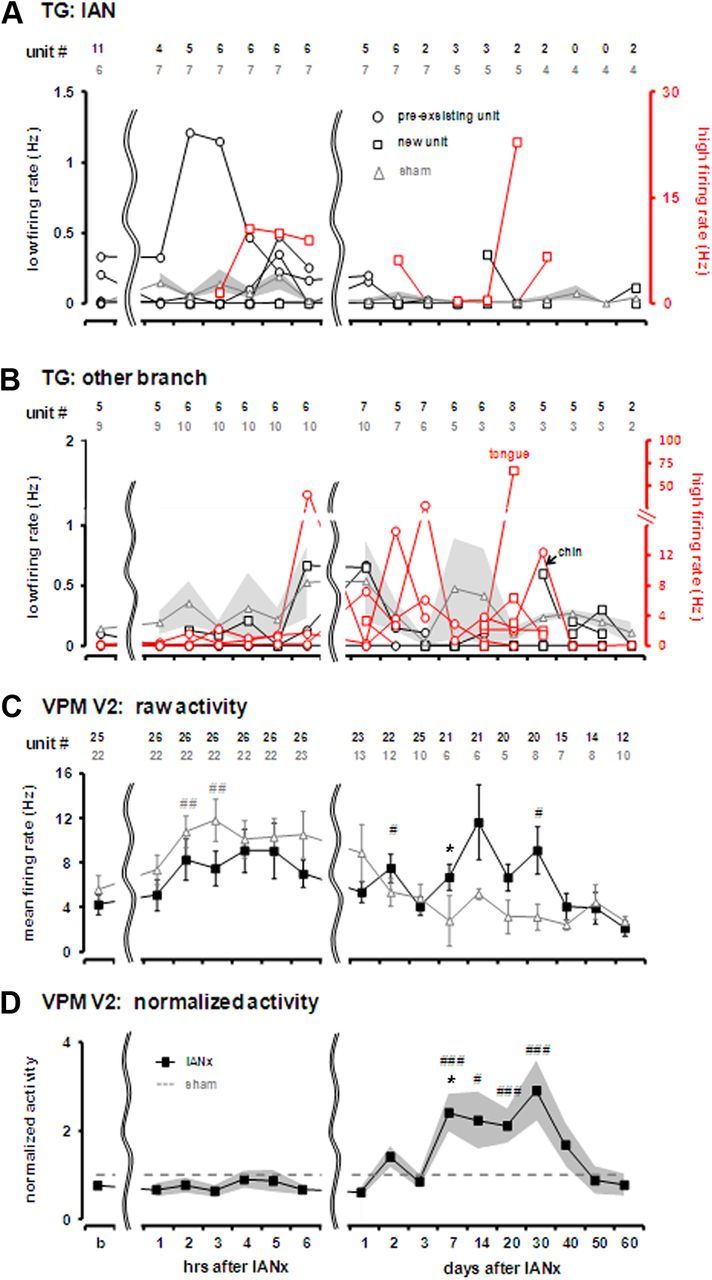
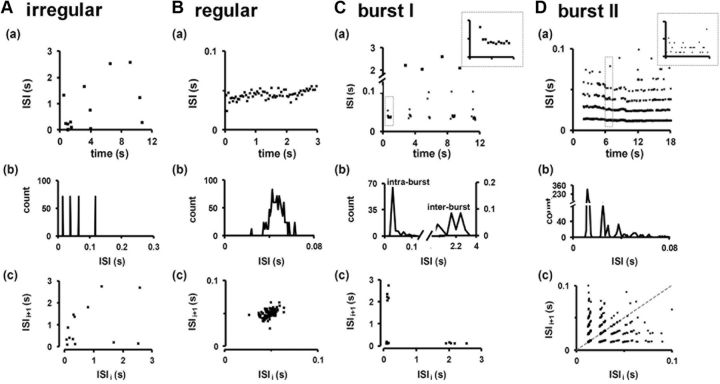
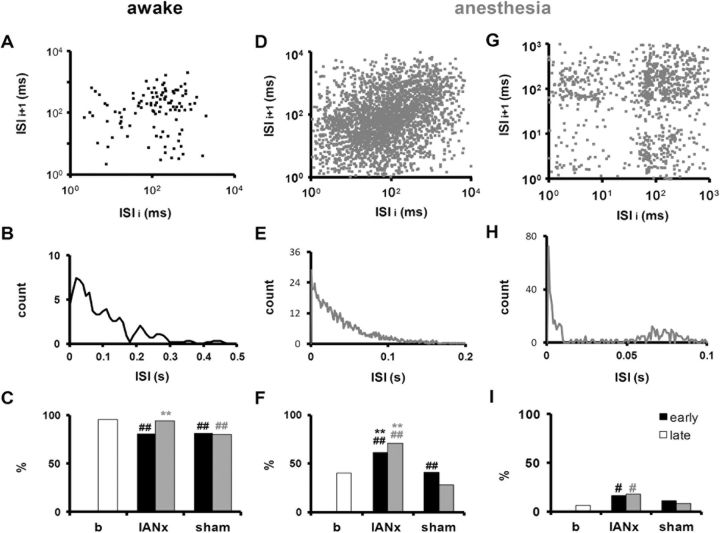
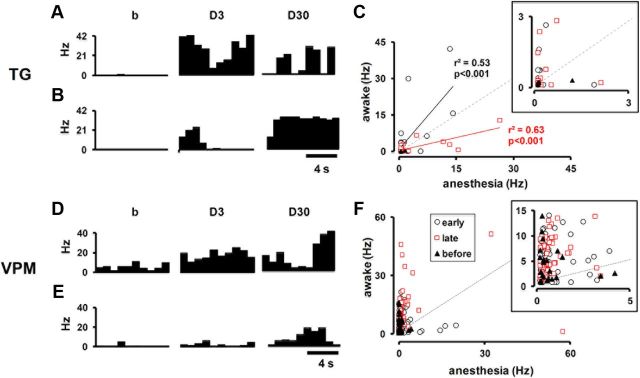
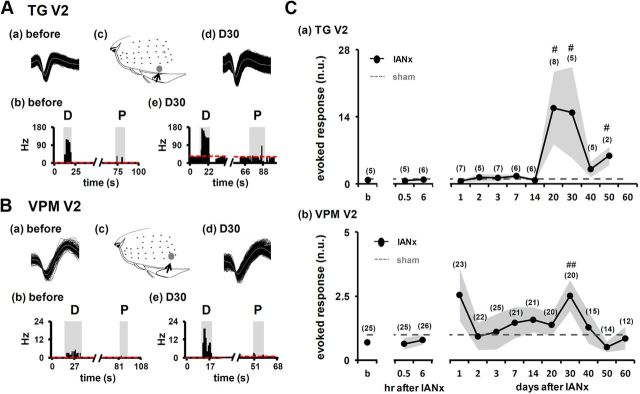
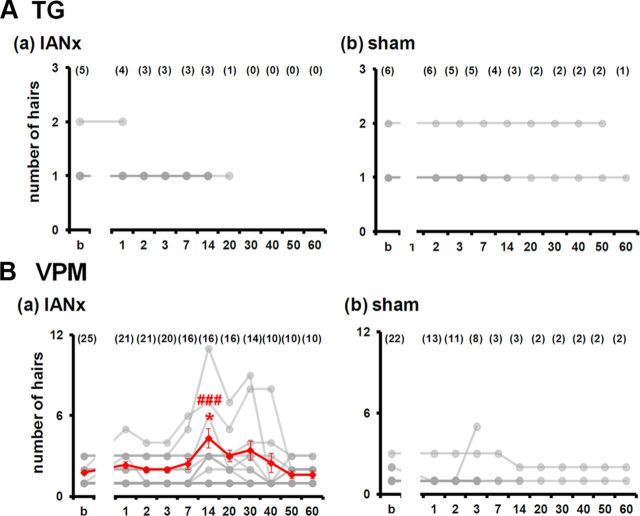
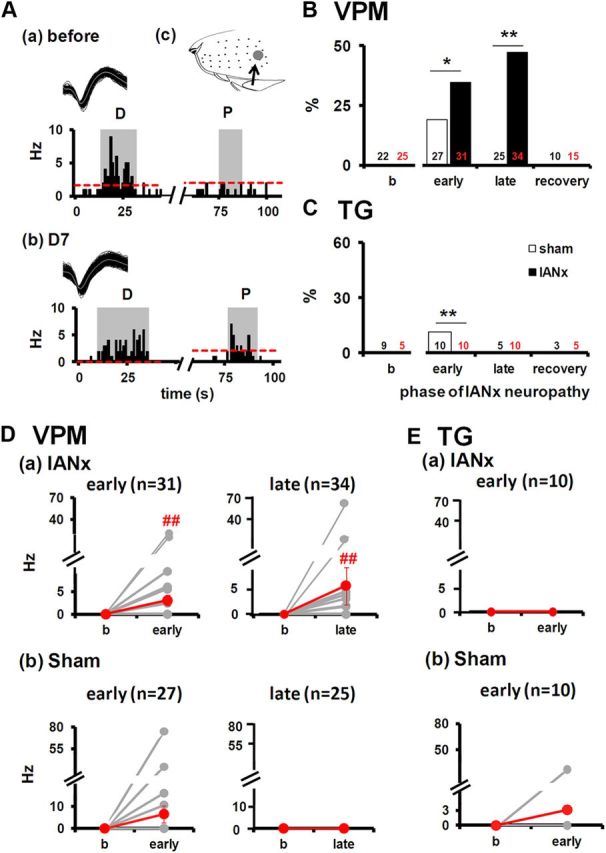
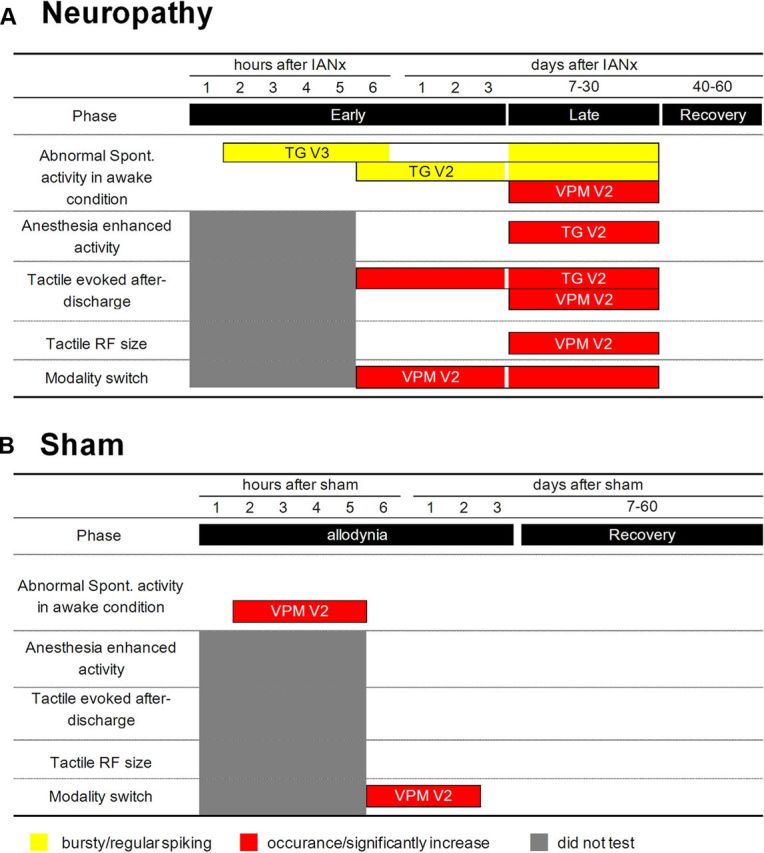
The transection of the inferior alveolar nerve (IANx) produces allodynia in the whisker pad (V2 division) of rats. Ectopic discharges from injured trigeminal ganglion (TG) neurons and thalamocortical reorganization are possible contributors to the sensitization of uninjured V2 primary and CNS neurons. To test which factor is more important, TG and ventroposterior medial nucleus (VPM) neurons were longitudinally followed before, during, and after IANx for up to 80 d. Spontaneous discharges and mechanical stimulation-evoked responses were recorded in conscious and in anesthetized states. Results show (1) a sequential increase in spontaneous activities, first in the injured TG neurons of the IAN (2-30 d), followed by uninjured V2 ganglion neurons (6-30 d), and then VPM V2 neurons (7-30 d) after IANx; (2) ectopic discharges included burst and regular firing patterns in the IAN and V2 branches of the TG neurons; and (3) the receptive field expanded, the modality shifted, and long-lasting after-discharges occurred only in VPM V2 neurons. All of these changes appeared in the late or maintenance phase (7-30 d) and disappeared during the recovery phase (40-60 d). These observations suggest that ectopic barrages in the injured IAN contribute more to the development of sensitization, whereas the modality shift and evoked after-discharges in the VPM thalamic neurons contribute more to the maintenance phase of allodynia by redirecting tactile information to the cortex as nociceptive.


Figures

Figure 1.
Figure 1.
Diagram of IANx model and tactile allodynia. A, IAN, a branch of V3 division of trigeminal nerve, is cut and the skin of whisker pad (V2 division) is sensitized (black, spiky spot). B, Face-escape threshold to von Frey stimuli before (b) and 1–60 d after IANx or a sham operation. Repeated-measures ANOVA showed significant differences between IANx ipsilateral/IANx contralateral and sham-operated ipsilateral groups indicated by ##p < 0.01 and ###p < 0.001; significant decreases on both sides of the face 1–30 d after IANx: *p < 0.05, **p < 0.01, and ***p < 0.001 (compared with the value before IANx). Shaded areas denote the mean ± SEM. Numerals in parentheses are the numbers of rats. ipsi, ipsilateral side to IANx; contra, contralateral side to IANx; b, before the operation.
Figure 2.
Figure 2.
Recording sites. A, B, Examples of histological sections of the TG and thalamus. Locations of successful recording were determined by electrolytic lesions (arrows). All TG (C) and VPM (D). Summary of locations of unit recorded from IANx (red circle) and sham-operated (open circle) rats. Arrowheads, tracks of microwires; V1 to V3, first to third branches of the trigeminal nerve. Scale bars: 500 μm.
Figure 3.
Figure 3.
Representative waveforms of stable TG (A, B) and VPM (C) units from the same microwire across days. All waveforms during the 10 min recording period on each recording session are shown. The RF of each unit is shown on the left. Stability was quantified by the maximum r value (gray numeral below each waveform), by comparing the average waveform of a given recording session with the one before IANx.
Figure 4.
Figure 4.
Sequential initiation of abnormal spontaneous firing in TG primary afferents and VPM in awake rats. A, Spontaneous ectopic activity of TG V3 units of the transected IAN, including new units without an RF, which began at the same day of the lesion. The right side of the y-axis is for units with high spontaneous activities (red), and the left side is for slower activities (black). Value of the unit discharge of the sham-operated group is presented as the mean ± SEM in the shaded area. B, Spontaneous activity of all TG V2 units plus two TG V3 units from uninjured nerve branches. RFs of these two TG V3 units were, respectively, in the tongue and chin. Increased spontaneous activities were mostly recorded on the second day and in the early and late stages. C, Raw VPM spontaneous activity in IANx and sham rats. Numerals listed at the top of each part are the unit number at each recording session in the transection of the IAN (IANx; black) and sham-operated (gray) rats. D, Normalized VPM spontaneous activity, divided by the average discharge rate of those in the sham-operated group. #p < 0.05, ##p < 0.01, ###p < 0.001 versus baseline (before IANx, b). *p < 0.05, versus the sham-operated group (original firing rates of the IANx and sham-operated groups were compared).
Figure 5.
Figure 5.
Ectopic firing pattern of the TG in awake rats with IANx. The ISI distribution of slow irregular (A), regular (B), burst I (C), and burst II (D) firing. Aa–Da, Representative examples of ISI versus time plots for four types of firing pattern. Each point indicates a single interval between two consecutive spikes. The y-axis in Ca is adjusted to emphasize the ISIs of <0.1 s. Detailed ISI distributions to the dashed gray box in Ca and Da are shown in the insets. ISI histogram and ISI return map of data in (a) display, respectively, in (b) and (c). Cb, Burst I shows two main peaks, indicating the ISI of intrabursts (short, 40 ms) and interbursts (long, ∼2 s). Bin sizes are 1 (left) and 400 (right) ms, respectively. ISI return map of burst I (Cc) represents one dense cluster with two arms, which corresponded to the interburst interval. Db, Burst II contains four main rhythms, and ISI peaks are 12, 26, 39, and 50 ms. Dc, ISI return map of burst II showing complex temporal features of the bursts.
Figure 6.
Figure 6.
A, B, Tonic firing pattern in the VPM in wakeful IANx and control (i.e., sham-operated and the data before IANx/sham operation) rats. A, ISI return map of a VPM V2 unit shows one dense cluster at the top right, which means equal pre- and post-ISIs and a tonic firing pattern. B, ISI histogram of data in A. C, Percentage of VPM V2 units, which displayed a tonic firing pattern in IANx (46 units), sham-operated (46 units), and normal rats (before the operation, b; 47 units). Early (6 h to 3 d) and late (7–30 d) periods after operation are separated for analysis. The data before IANx and the sham operation were pooled in Group b. D–I, Under anesthesia, tonic and burst VPM V2 units increased after IANx. D–F and G–I are respective examples of temporal patterns of tonic firing and bursting. D and G are ISI return maps. Note the four clusters in G. The bottom right cluster mostly represents the first spikes in the burst. The bottom left cluster mostly represents spikes in the bursts, and the upper left cluster mostly indicates the last spikes in the burst. The upper right cluster mostly represents spikes in tonic mode. E and H are ISI histograms of data in D and G. Percentages of tonic (F) and burst (I) VPM V2 units in normal, IANx, and sham-operated rats. Both firing types significantly increased after IANx. #p < 0.05, ##p < 0.01 versus b (before IANx); **p < 0.01, versus sham-operated rats according to a χ2 test.
Figure 7.
Figure 7.
Differential anesthetic effect on spontaneous activities of TG V2 and VPM V2 units. A, B, Spontaneous activities of a TG V2 unit under awake (A) and anesthetic conditions (B) on the day before IANx and 3 and 30 d after IANx. During the early phase of allodynia (D3), isoflurane administration attenuated the spontaneous activity at 50 s from the beginning of the recording, whereas such suppression did not occur in the same unit during the late phase of allodynia (D30). C, Distributions of spontaneous activity pairs in the anesthesia and awake conditions (from 19 TG V2 units). Each point represents the spontaneous activity of the same unit in both conditions. Data obtained from several days is separated into three groups: baseline (b; 5 units, 5 pairs), 6 h to 3 d after IANx (early; 10 units, 26 pairs), and 7–30 d after IANx (late; 10 units, 24 pairs). Correlation coefficients of early (red) and late (black) populations are shown. During the late phase of allodynia, isoflurane enhanced the spontaneous activity because the linear curve shifted to the right side of the gray dotted line, indicating a lack of anesthetic effects. D, E, Spontaneous activity of a VPM V2 unit in the awake (D) and anesthesia (E) conditions. All pairs of 46 VPM V2 units across days between awake and anesthetized conditions are plotted in F. Isoflurane attenuated spontaneous activity of most of the VPM V2 unit during early-phase (31 units, 72 pairs) and late-phase (34 units, 78 pairs) allodynia and baseline firing frequency (25 units, 25 pairs). The correlation between both conditions disappeared (r2 < 0.1). The bin size of the rate histogram was 1 s. Low firing-rate data in C and F are expanded and shown in insets.
Figure 8.
Figure 8.
Increased evoked responses of TG and VPM V2 units to tactile mechanical stimulation after IANx. Examples from stable TG and VPM tactile units are shown in A and B, respectively. Both low-threshold whisker units (the RF is indicated by an arrow in Ac and Bc) in TG and VPM responded to deflection (D) stimulation of the whiskers, but not to pinch (P) stimulation. The gray shaded area denotes the stimulation period. A responsive criterion (red dotted line) is the mean + 2.33 SD of the 10 s baseline preceding each stimulation. At 30 d after IANx, evoked responses of TG and VPM units to tactile stimulation were enhanced (Ae and Be). Waveforms of units obtained from different time points are shown in a and d. C, Time-course changes in normalized evoked responses after IANx. The evoked response was normalized, divided by the mean value of the sham-operated group. The shaded area indicates the mean ± SEM. #p < 0.05, ##p < 0.01, significantly differs from activity before IANx by the Mann–Whitney U test. Numerals in parentheses are the numbers of units.
Figure 9.
Figure 9.
Expansion of RF size of VPM units after IANx. A, Hair numbers of TG units in IANx (Aa) and sham-operated rats (Ab). The partially transparent gray dot denotes the number of hairs of each unit determined on a given day. B, Number of hairs of VPM units significantly increased after IANx (###p < 0.001). The average value (red), calculated from 10 units with expanded RFs, is represented as the mean ± SEM. Numerals in parentheses are the unit numbers. *p < 0.05 compared with sham group.
Figure 10.
Figure 10.
Modality shift of VPM V2 units after IANx. A, Example from a stable whisker unit in the VPM before (Aa) and 7 d after IANx (Ab). This unit changed to be responsive to a pinch (P) of the skin over the RF (arrow in Ac) after IANx. The gray shaded area in the histogram denotes the stimulation period. The red dotted line indicates the responsive criteria, evaluated by the mean + 2.33 SD of the 10 s baseline preceding each stimulation. D, Deflection of whiskers. The percentage of pinch-responsive units in the VPM (B) and TG (C) before IANx and during the early (6–3 d), late (730 d), and recovery (40–60 d) phases of neuropathic pain. Red and black numerals are unit numbers from IANx and sham-operated rats, respectively. A significant difference of pinch-responsive units with the sham group was evaluated by χ2 or Fisher's exact test, respectively, indicated by *p < 0.05 and **p < 0.01. The average response amplitude to pinch stimulation in VPM V2 units was significantly enhanced after IANx (Da), whereas there was no difference in the sham-operated group (Db, Eb) or in the group of TG V2 units (Ea). ##p < 0.01, versus the baseline (the day before the IANx/sham operation) by the Wilcoxon signed-rank test.
Figure 11.
Figure 11.
Summary schematic diagram of the possible underlying neural mechanism of allodynia in neuropathic pain (IANx vs sham-operated) and sham operation-induced pain (sham-operated vs the baseline) conditions. A, In the neuropathic condition, the pathological process was separated into three phases: early, late, and recovery phases. During the early phase, injured A fibers (TG V3) produce burst-like or regular ectopic discharges followed by sensitization of adjacent uninjured A fibers (TG V2). These uninjured fibers transfer abnormal messages to the same division of the somatosensory thalamus (VPM V2), and trigger central sensitization in the late phase. These tactile VPM V2 neurons tend to have expanded RFs and tactile-evoked after-discharges, and tend to be sensitive to a pinch stimulus. Activation of these neurons by tactile stimulation may be mistaken as nociceptive information by the cortex and cause allodynia. In addition, when the pathological process is complete, anesthetics (or analgesic drugs) no longer reduce abnormal discharges. B, Sham operation also produces transient extraterritorial allodynia, and only VPM V2 neurons display hyperexcitability. This shows that (1) cross talk in the CNS may produce extraterritorial allodynia of inflammation pain and (2) burst and regular spiking primary afferents are key injury messages to initiate the pathological process of neuropathy and strengthen central sensitization in the thalamus to maintain neuropathic pain.

Similar articles

Cited by

References

    1. Adrian ED. The effects of injury on mammalian nerve fibres. Proc Roy Soc Ser B. 1930;106:596–618.
    1. Amir R, Michaelis M, Devor M. Membrane potential oscillations in dorsal root ganglion neurons: role in normal electrogenesis and neuropathic pain. J Neurosci. 1999;19:8589–8596. - PMC - PubMed
    1. Amir R, Michaelis M, Devor M. Burst discharge in primary sensory neurons: triggered by subthreshold oscillations, maintained by depolarizing afterpotentials. J Neurosci. 2002;22:1187–1198. - PMC - PubMed
    1. Barbay S, Peden EK, Falchook G, Nudo RJ. Sensitivity of neurons in somatosensory cortex (S1) to cutaneous stimulation of the hindlimb immediately following a sciatic nerve crush. Somatosens Mot Res. 1999;16:103–114. - PubMed
    1. Baron R. Mechanisms of disease: neuropathic pain—a clinical perspective. Nat Clin Pract Neurol. 2006;2:95–106. - PubMed

Publication types

LinkOut - more resources