. 2012 Jan;61(5):437-44.
doi: 10.1270/jsbbs.61.437. Epub 2012 Feb 4.

Evolutionary and comparative analyses of the soybean genome

Affiliations

Evolutionary and comparative analyses of the soybean genome

Steven B Cannon et al. Breed Sci. 2012 Jan.

Abstract

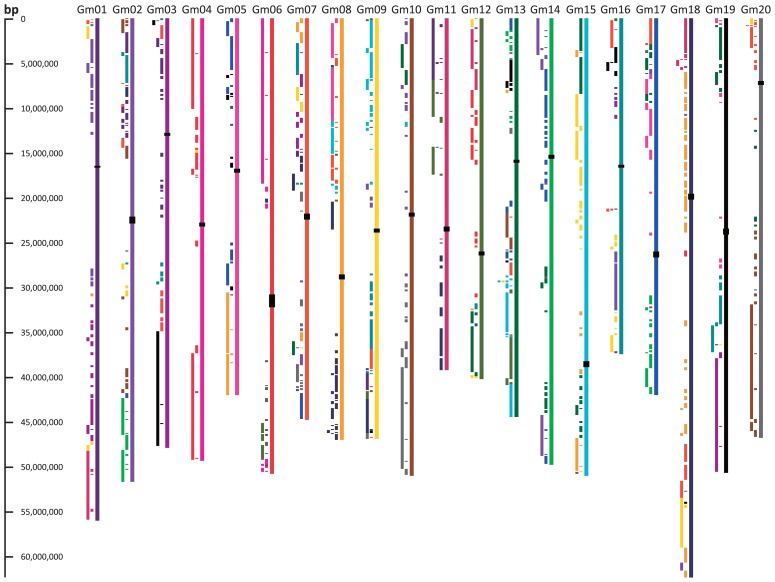
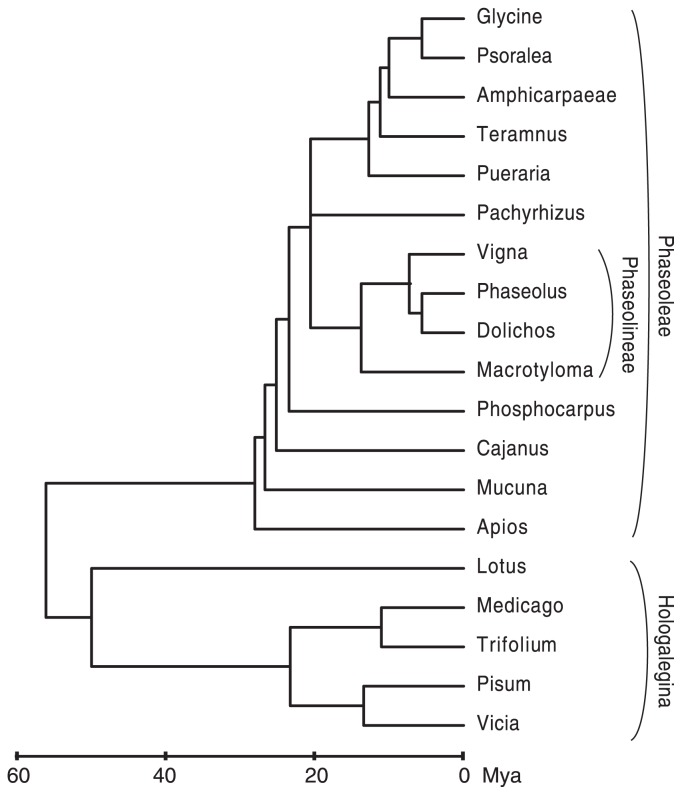
The soybean genome assembly has been available since the end of 2008. Significant features of the genome include large, gene-poor, repeat-dense pericentromeric regions, spanning roughly 57% of the genome sequence; a relatively large genome size of ~1.15 billion bases; remnants of a genome duplication that occurred ~13 million years ago (Mya); and fainter remnants of older polyploidies that occurred ~58 Mya and >130 Mya. The genome sequence has been used to identify the genetic basis for numerous traits, including disease resistance, nutritional characteristics, and developmental features. The genome sequence has provided a scaffold for placement of many genomic feature elements, both from within soybean and from related species. These may be accessed at several websites, including http://www.phytozome.net, http://soybase.org, http://comparative-legumes.org, and http://www.legumebase.brc.miyazaki-u.ac.jp. The taxonomic position of soybean in the Phaseoleae tribe of the legumes means that there are approximately two dozen other beans and relatives that have undergone independent domestication, and which may have traits that will be useful for transfer to soybean. Methods of translating information between species in the Phaseoleae range from design of markers for marker assisted selection, to transformation with Agrobacterium or with other experimental transformation methods.

Keywords: Glycine max; Legume Information System; Legumebase; Phytozome; SoyBase; legume evolution; polyploidy; soybean.


Figures

Fig. 1
Fig. 1
Duplicated segments within the soybean genome. Colored blocks to the left of each chromosome show regions of correspondence with chromosomes of the same color. For example, the light blue blocks at the top of Gm09 correspond with regions on the light blue Gm15, and vice versa. These correspondences are remnants after the Glycine genome duplication. Locations of centromeric repeats are shown as black rectangles over the chromosomes. Regions lacking internal correspondences (generally near chromosome centers) mark the approximate locations of the gene-poor pericentromeres. This figure is derived from the CViT genome search and synteny viewer (Cannon and Cannon (submitted)) at the Legume Information System, http://comparative-legumes.org/.
Fig. 2
Fig. 2
Close comparison of two soybean chromosomes. The soybean chromosome 10 assembly (Gm10, horizontal) and chromosome 20 assembly (Gm20, vertical) are shown. Each dot represents homology of predicted coding sequences in the two chromosomes. Faint dotted lines show the boundaries of smaller sequence assemblies that were ordered to produce the chromosome-scale assemblies. Diagonal features in the upper right quadrant indicate corresponding regions between these two chromosomes. A large inversion is indicated by a line of homology dots that slopes down and to the right. The interrupted diagonal toward the center has been disrupted by transposon insertions in pericentromeric regions in both chromosomes. The pericentromeric regions are also marked by higher densities of dots (homologies) in roughtly the lower-left two thirds of the space, primarily caused by retrotransposon sequences.
Fig. 3
Fig. 3
Genetic vs. physical distances for chromosome 10. Sequence-based genetic markers (cM units, vertical axis) have been compared with the soybean chromosomal genome assembly to determine their physical locations (100 kb units, horizontal axis). The pattern of steep slopes at the chromosome ends and flat slopes in the centers is common across all 20 chromosomes, and corresponds with high rates of recombination in the gene-rich euchromatic chromosomal ends and suppressed recombination in the repeat-rich, gene-poor chromosomal centers.
Fig. 4
Fig. 4
Phylogeny of soybean and some related species. Genera that include soybean and other domesticated bean species are shown, along with other selected model legume species. Estimated coalescence times (times to common ancestral nodes) are inferred from phylogenies and datings in Lavin et al. (2005) and Stefanovic and Doyle (2009).
Fig. 5
Fig. 5
Comparison of two soybean chromosomes with a Phaseolus linkage group. Sequence-based markers in Phaseolus vulgaris linkage group Pv01 (center) is compared with soybean chromosomes Gm06 (left) and Gm04 (right). The comparisons are modified from comparative map displays at the Legume Information System (http://comparative-legumes.org). The Phaseolus map is the 2009 map of Conserved Orthologous Sequences from Doug Cook (Choi et al. 2004, 2006).

Similar articles

Cited by

References

    1. Bennett M, Leitch I. Angiosperm DNA C-values database (release 5.0, December 2010) 2010.
    1. Bolon YT, Joseph B, Cannon SB, Graham MA, Diers BW, Farmer AD, May GD, Muehlbauer GJ, Specht JE, Tu ZJ, et al. Complementary genetic and genomic approaches help characterize the linkage group I seed protein QTL in soybean. BMC Plant Biol. 2010;10:41. - PMC - PubMed
    1. Campbell RJ, Hartman GR, Noel GR, Hymowitz T. Identification of resistance to soybean cyst nematode in Glycine tomentella. Phytopathology. 2000;91S:176.
    1. Cannon EKS, Cannon SB. CViT: “Chromosomal Visualization Tool”—a whole-genome viewer. Int J Plant Genomics ((submitted)) - PMC - PubMed
    1. Cannon SB, Sterck L, Rombauts S, Sato S, Cheung F, Gouzy J, Wang X, Mudge J, Vasdewani J, Schiex T, et al. Legume genome evolution viewed through the Medicago truncatula and Lotus japonicus genomes. Proc. Natl. Acad. Sci. USA. 2006;103:14959– 14964. - PMC - PubMed

LinkOut - more resources