

Evaluation of soybean germplasm conserved in NIAS genebank and development of mini core collections
- PMID: 23136496
- PMCID: PMC3406788
- DOI: 10.1270/jsbbs.61.566
Evaluation of soybean germplasm conserved in NIAS genebank and development of mini core collections
Abstract
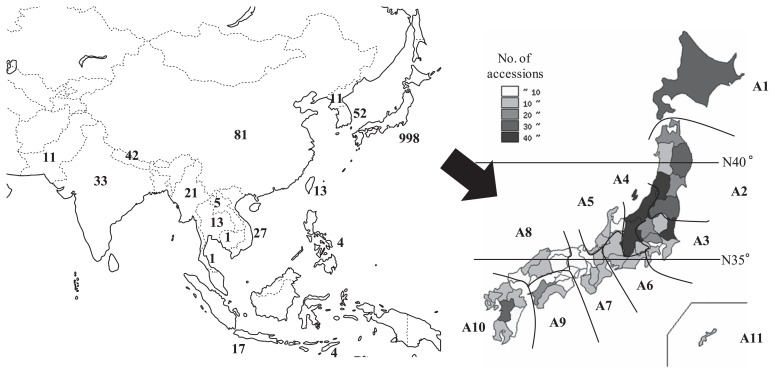
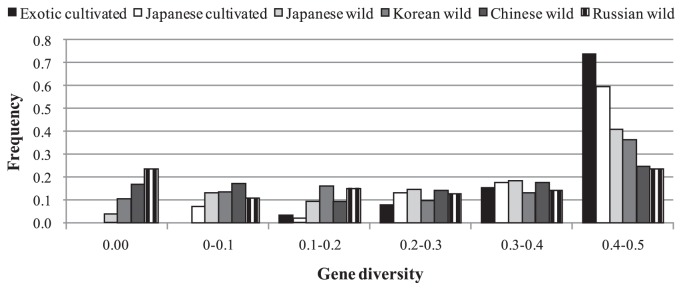
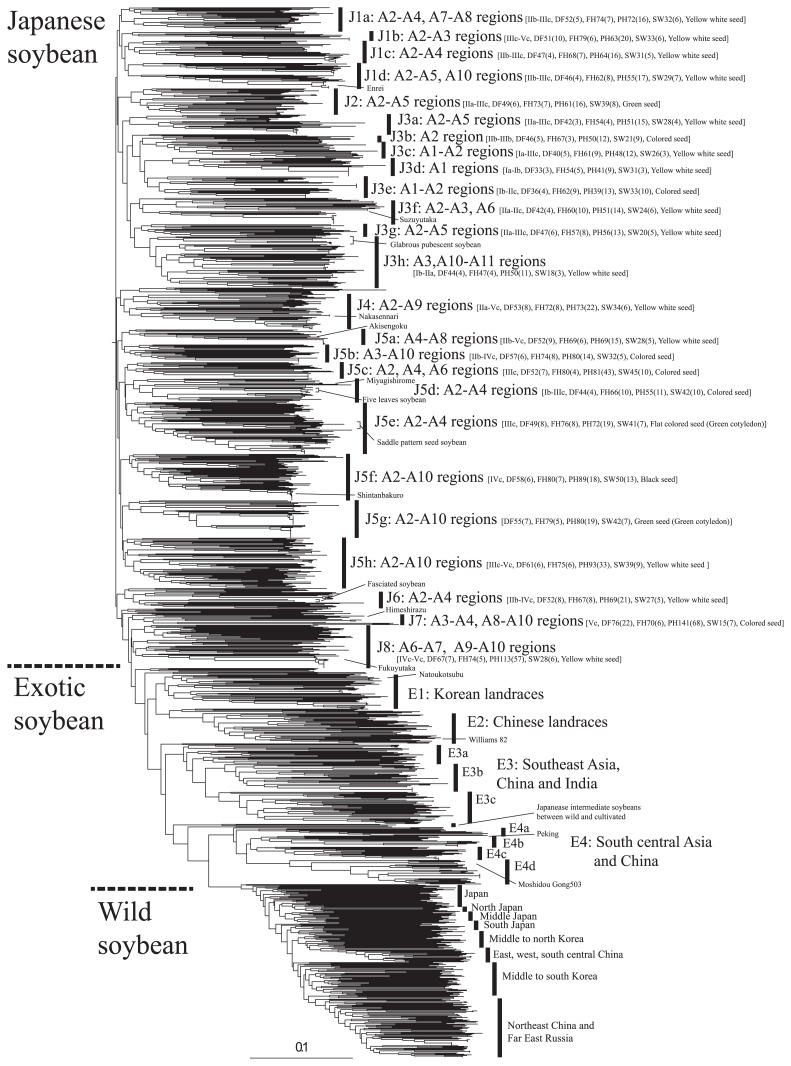
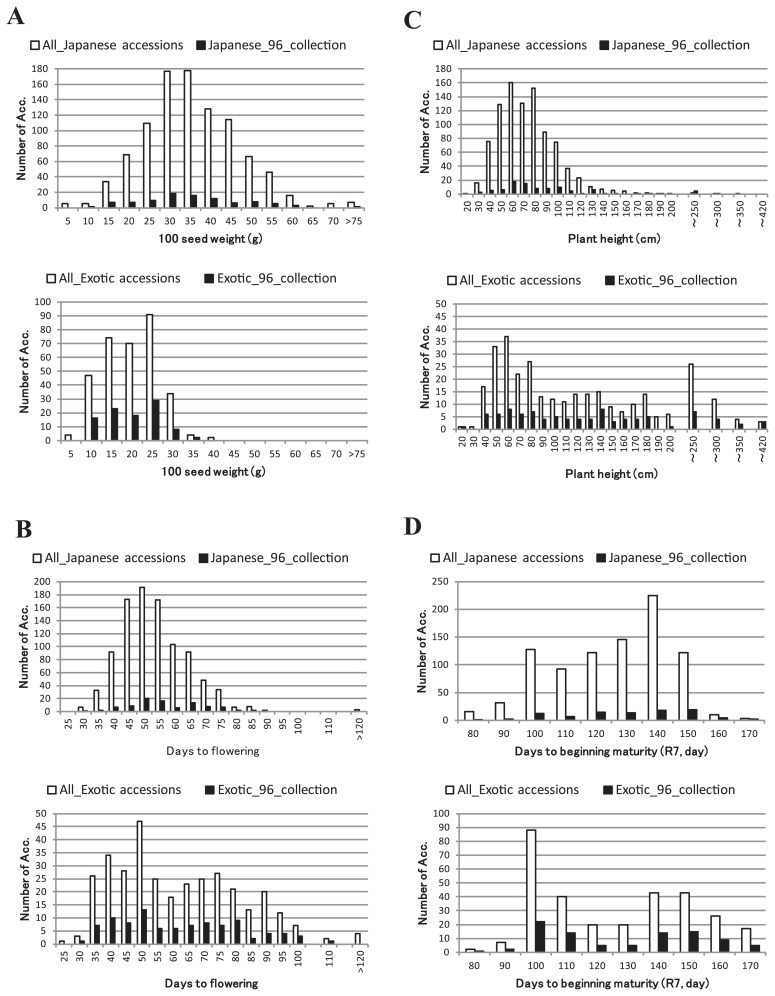
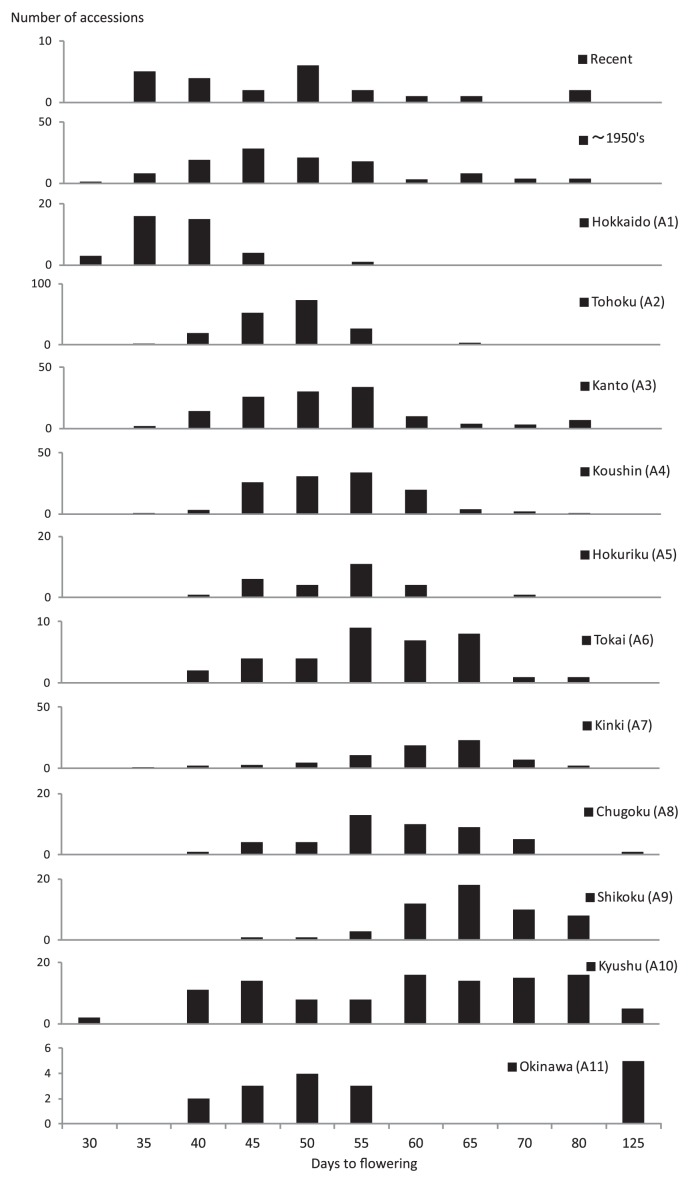
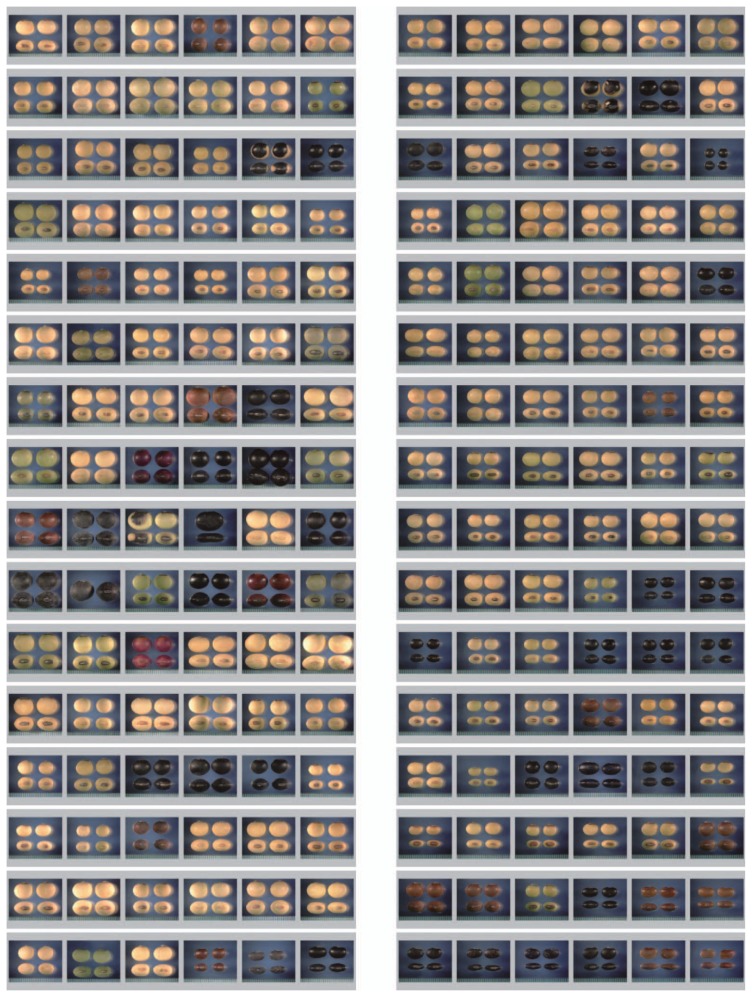
Genetic variation and population structure among 1603 soybean accessions, consisted of 832 Japanese landraces, 109 old and 57 recent Japanese varieties, 341 landrace from 16 Asian countries and 264 wild soybean accessions, were characterized using 191 SNP markers. Although gene diversity of Japanese soybean germplasm was slight lower than that of exotic soybean germplasm, population differentiation and clustering analyses indicated clear genetic differentiation among Japanese cultivated soybeans, exotic cultivated soybeans and wild soybeans. Nine hundred ninety eight Japanese accessions were separated to a certain extent into groups corresponding to their agro-morphologic characteristics such as photosensitivity and seed characteristics rather than their geographical origin. Based on the assessment of the SNP markers and several agro-morphologic traits, accessions that retain gene diversity of the whole collection were selected to develop several soybean sets of different sizes using an heuristic approach; a minimum of 12 accessions can represent the observed gene diversity; a mini-core collection of 96 accession can represent a major proportion of both geographic origin and agro-morphologic trait variation. These selected sets of germplasm will provide an effective platform for enhancing soybean diversity studies and assist in finding novel traits for crop improvement.
Keywords: Genebank; Glycine max; Glycine soja; LD; SNP; mini core collection.
Figures

References
-
- Abe J, Hasegawa A, Fukushi H, Ikami TM, Ohara M, Shimamoto Y. Introgression between wild and cultivated soybeans of Japan revealed by RFLP analysis for chloroplast DNAs. Econ Bot. 1999;53:285–291.
-
- Abe J, Xu DH, Suzuki Y, Kanazawa A, Shimamoto Y. Soybean germplasm pools in Asia revealed by SSR. Theor Appl Genet. 2003;106:445–453. - PubMed
-
- Albertsen MC, Curry TM, Palmer RG, Lamotte CE. Genetics and comparative growth morphology of fasciation in soybeans (Glycine max (L.) Merr) Bot Gaz. 1983;144:263–275.
-
- Aman D, Sultoni A, Hidajat N, Dauphin F, Morooka Y, Rachim A. Government Policy, Regulations and Support Programs. Research for varietal improvement. In: Bottemat T, editor. The Soybean Commodity System in Indonesia, CGPRT No. 3, Bogor. CGPRT. 1988. pp. 84–85.
Grants and funding
LinkOut - more resources
Full Text Sources
Research Materials