. 2012 Dec;93(6):429-37.
doi: 10.1111/j.1365-2613.2012.00843.x.

Chronic caffeine intake increases androgenic stimuli, epithelial cell proliferation and hyperplasia in rat ventral prostate

Affiliations

Chronic caffeine intake increases androgenic stimuli, epithelial cell proliferation and hyperplasia in rat ventral prostate

Carolina Sarobo et al. Int J Exp Pathol. 2012 Dec.

Abstract

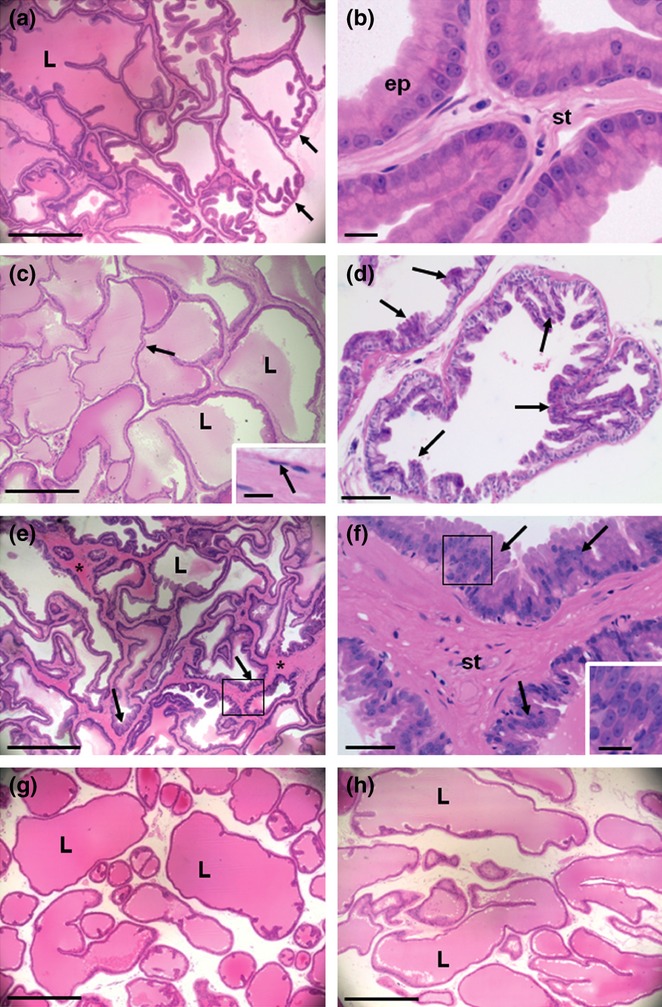
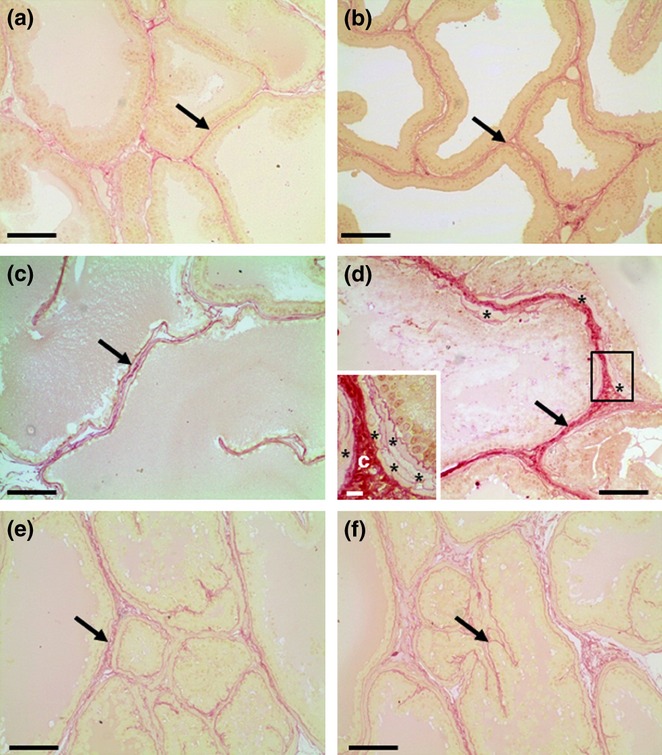
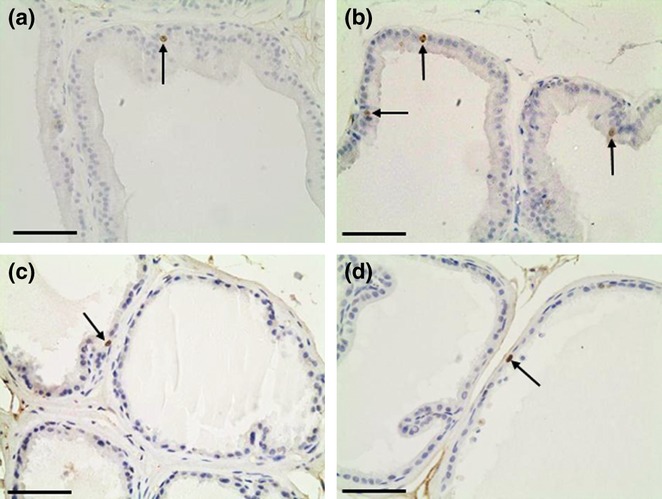
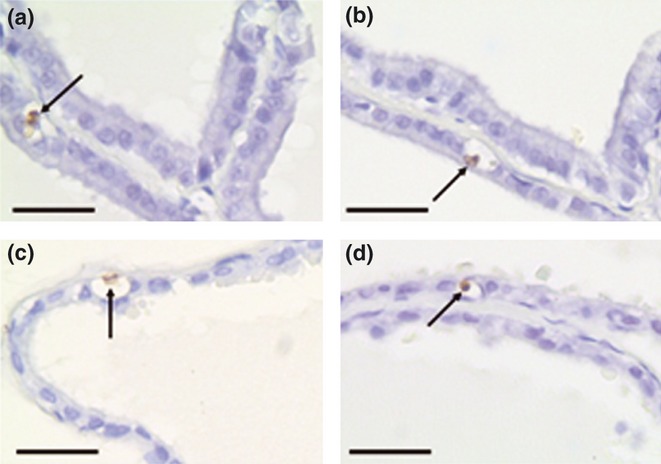
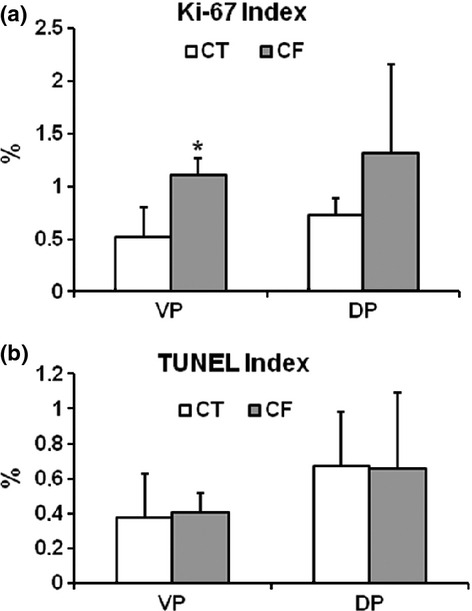
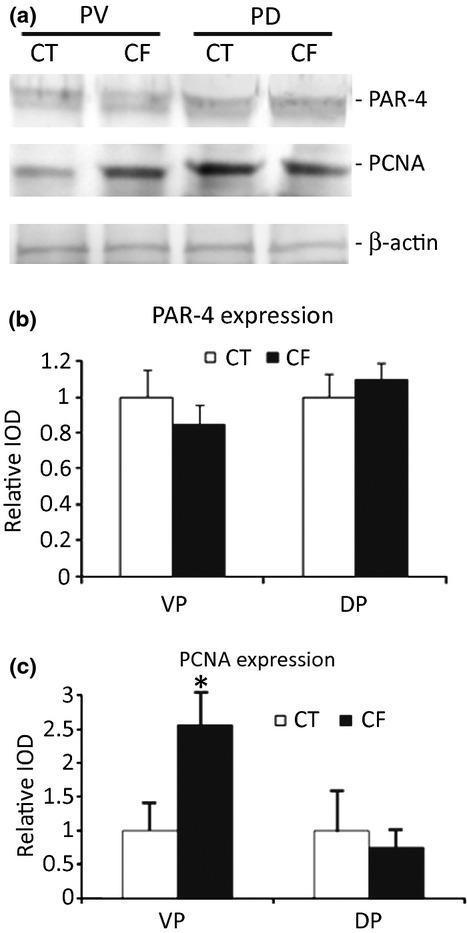
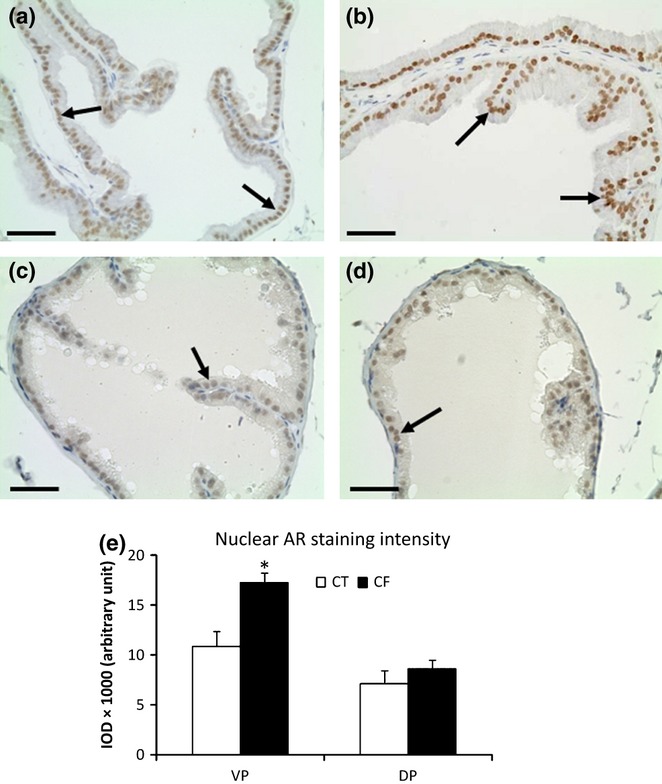
Coffee intake has been associated with a low risk of developing cancer, including prostate cancer, which is one of the most commonly diagnosed cancer in men. However, few studies have evaluated the chronic effects of caffeine, which is the most abundant methylxanthine in coffee, on prostate morphology and physiology. In the present study, we investigated the effects of chronic, low-dose caffeine intake on rat prostate morphology from puberty to adulthood. Five-week-old male Wistar rats were randomized into two experimental groups: caffeine-treated (20 ppm in drinking water, n = 12) and control (n = 12). The ventral and dorsolateral prostates were dissected, weighted and submitted to morphological, morphometrical and immunohistochemical analysis of cellular proliferation, apoptosis and androgen receptor (AR) tissue expression. The testosterone (T) and dihydrotestosterone (DHT) concentrations were measured in the plasma. Our results show that caffeine intake increased the concentrations of T and DHT, organ weight, epithelial cell proliferation and AR tissue expression in the ventral prostatic lobe. All the ventral prostates from the caffeine-treated animals presented various degrees of epithelial and stromal hyperplasia. Our results suggest that chronic caffeine intake from puberty increases androgenic signalling and cell proliferation in the rat prostate gland and can be related to the development of benign prostatic hyperplasia.


Figures

Figure 1
Figure 1
Morphological aspects of control (a, b, g) and caffeine-treated (c–f, h) ventral (VP) (a–f) and dorsal (DP) (g, h) prostatic lobes stained by haematoxylin–eosin. (a) VP from the control group showing the acini structures with large lumen (L) lined by regular tall columnar epithelium. The folds of the epithelium were concentrated in the distal edge of the acini (arrows). (b) Detail of the control VP showing regular and well-polarized epithelial cells (ep) and the thin stroma (st). (c) VP from caffeine-treated animals exhibiting enlarged luminal space (L) and reduced epithelium height and infoldings (arrows). Insert: detail from figure c showing simple squamous epithelium lining the acini (arrow). (d) VP from caffeine-treated animals presenting focal tufting and papilliferous epithelial hyperplasia (arrows), without stromal hyperplasia, at the distal region of the acini. (e) VP from caffeine-treated animals presenting more extensive and uniform process of combined and diffuse epithelial (arrows) and stromal (asterisks) hyperplasia. (f) Detail of figure e (square) showing stromal (st) enlargement and epithelial hyperplasia with micropapillary pattern (arrows). Insert: detail of figure f (square) showing micropapillary structures and nuclei with prominent nucleoli, without cellular atypia. (g) DP from control and (h) DP from caffeine-treated group. No significant morphological differences were observed in the DP between the groups. Scale bars: a, c, e, g and h = 500 μm; b and inserts = 10 μm; d = 100 μm; f = 50 μm.
Figure 2
Figure 2
Picrosirius-stained sections of control (a, e) and caffeine-treated (b, c, d) prostatic lobes. Ventral (a–d) and dorsal (e–f) prostates. Collagen fibers (arrows) are observed around acini, mainly in the interstitial space. (b) Caffeine-treated prostate presenting area with similar morphology and collagen distribution (arrows) than control group. (c) Caffeine-treated prostate showing enlarged acini and regular collagen fibers (arrow) distribution in the reduced stroma. (d) Hyperplasic area of caffeine-treated prostate showing increased amount of collagen fibers (arrow) in the interstitial space and thickened layer of smooth muscle cells (asterisks). Insert: Detail of the figure d (square) showing thickened collagen fibers (c) and smooth muscle cells layer (asterisks). Scale bars: a–f = 50 μm; Insert = 10 μm.
Figure 3
Figure 3
Representative sections of control (a, c) and caffeine-treated (b, d) prostatic lobes submitted to immunohistochemistry for Ki-67. Ventral (a, b) and dorsal (c, d) prostates. Note an increased number of Ki-67 positive nuclei (arrows) in caffeine-treated ventral prostates when compared with control. Scale bars: 30 μm.
Figure 4
Figure 4
Representative sections of control (a, c) and caffeine-treated (b, d) prostatic lobes submitted to the Transferase-Mediated Biotinylated UTP Nick End-Labelling (TUNEL) reaction. Ventral (a, b) and dorsal (c, d) prostates. The arrows indicate typical positively stained apoptotic epithelial cells that were used to determine the TUNEL index. Scale bars: 10 μm.
Figure 5
Figure 5
Bars graph of the proliferation and apoptotic indexes of the epithelial cells from control (CT) and caffeine-treated (CF) prostatic lobes. Ventral (VP) and dorsal (DP) prostatic lobes. (a) The proliferation index was significantly higher in the VP from the CF group. (b) No significant differences in the prostatic lobe epithelial cell apoptotic index were observed between the groups. Results are expressed as mean ± SD. *P < 0.05 when compared with the CT group.
Figure 6
Figure 6
(a) Representative Western blotting for PAR-4, proliferation cell nuclear antigen (PCNA) and beta-actin expression in the rat ventral (VP) and dorsal (DP) prostatic lobes from the control (CT) and caffeine-treated animals (CF). (b) Densitometric analysis of the PAR-4 bands showing no differences between the groups in both prostatic lobes. (c) Densitometric analysis of the PCNA bands showing a significant higher expression only in the VP from the CF group. Results are expressed as mean ± SD. *Significantly different with P < 0.05.
Figure 7
Figure 7
Immunohistochemistry for the androgen receptor (AR) in control (a, c) and caffeine-treated (b, d) prostates. Ventral (VP) (a, b) and dorsal (DP) (c, d) prostatic lobes. Note a uniform and higher intensity of the positive reaction in the nuclei (arrows) of the VPs from caffeine-treated group (CF) compared with the VPs from the control group. Scale bars: 30 μm. (e) Semi-quantitative analysis (IOD, integrated optical density) of the nuclear AR immunoreactivity of the epithelial cells from VP and DP in control (CT) and CF showing significant higher AR staining in the VP nuclei from CF group than CT group. Mean ± SD. Statistically significant differences: *P < 0.05.

Similar articles

Cited by

References

    1. Bartsch G, Rittmaster RS, Klocker H. Dihydrotestosterone and the concept of 5alpha-reductase inhibition in human benign prostatic hyperplasia. World J. Urol. 2002;19:413–425. - PubMed
    1. Bettuzzi S, Brausi M, Rizzi F, Castagnetti G, Peracchia G, Corti A. Chemoprevention oh human prostate cancer by oral administration of green tea catechins in volunteers with high-grade prostate intraepithelial neoplasia: a preliminary report from a one-year proof-of-principle study. Cancer Res. 2006;66:1234–1240. - PubMed
    1. Bode AM, Dong Z. The enigmatic effects of caffeine in cell cycle and cancer. Cancer Lett. 2007;247:26–39. - PMC - PubMed
    1. Bradford MM. A rapid and sensitive method for the quantitation of microgram quantities of protein utilizing the principle of protein-dye binding. Anal. Biochem. 1976;72:248–254. - PubMed
    1. Butt MS, Sultan MT. Coffee and its consumption: benefits and risks. Crit. Rev. Food Sci. Nutr. 2011;51:363–373. - PubMed

Publication types

MeSH terms