

Cost-effectiveness analysis of different rescue therapies in patients with lamivudine-resistant chronic hepatitis B in China
- PMID: 23137013
- PMCID: PMC3511237
- DOI: 10.1186/1472-6963-12-385
Cost-effectiveness analysis of different rescue therapies in patients with lamivudine-resistant chronic hepatitis B in China
Abstract
Background: Several rescue therapies have been used in patients with lamivudine (LAM)-resistant chronic hepatitis B (CHB); however, the economic outcome of these therapies is unclear. The object of the current analysis was to evaluate the lifetime cost-effectiveness of rescue therapies among patients with LAM-resistant CHB.
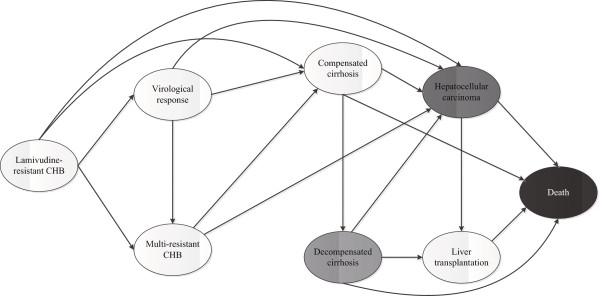
Methods: A Markov model was developed to simulate the clinical course of patients with LAM-resistant CHB. From the perspective of Chinese health care, a lifetime cost-utility analysis was performedfor 4 rescue strategies: adefovir (ADV), entecavir (ETV) or tenofovir (TDF) monotherapy and combination therapy using LAM and ADV. A hypothetical cohort of 45-year-old patients with genotypic or clinical LAM-resistant CHB entered the model, and the beginning health state was LAM-resistant CHB without other complications. The transition probabilities, efficacy and resistance data for each rescue therapy as well as the costs and utility data were estimated from the literature. The discount rate (3%) utilized for costs and benefits. Sensitivity analyses were used to explore the impact of uncertainty on the results.
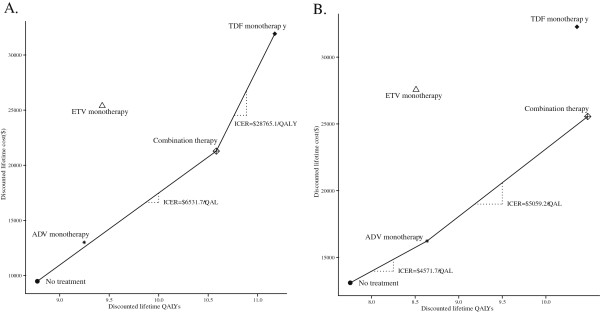
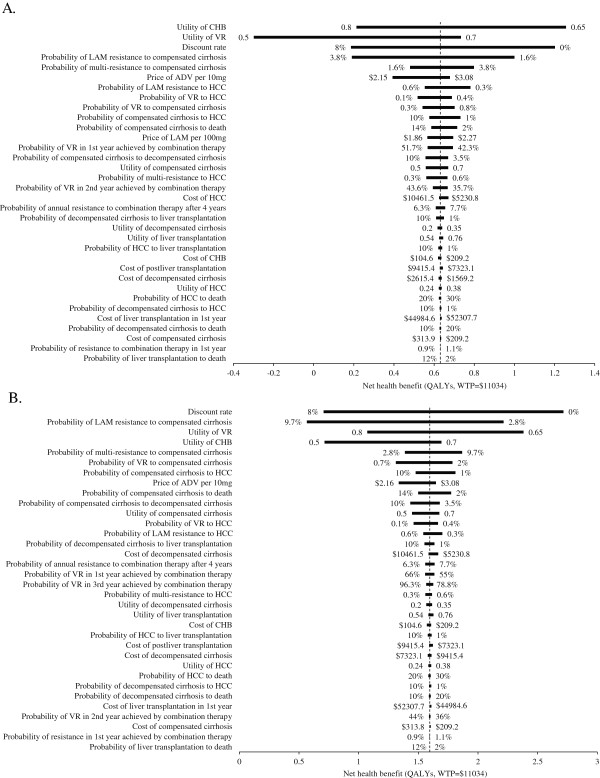
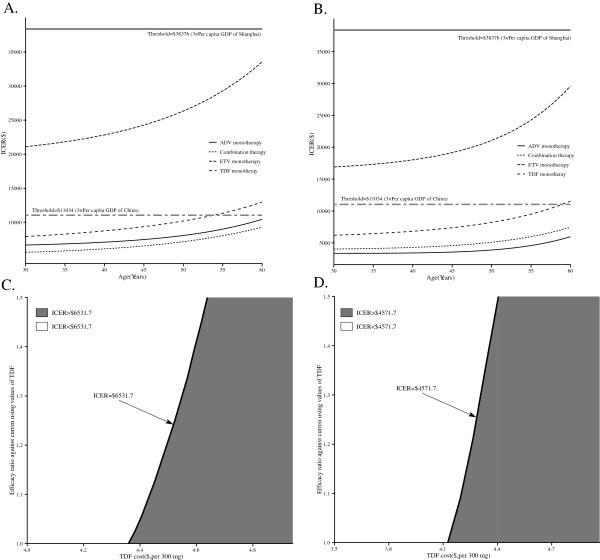
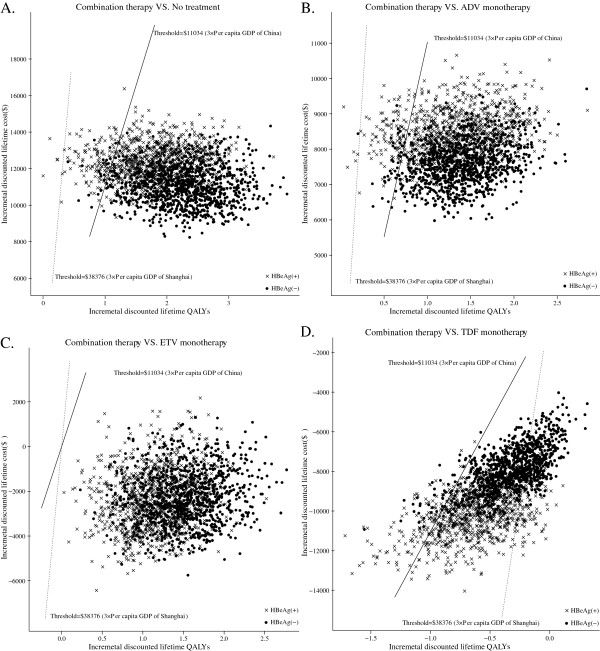
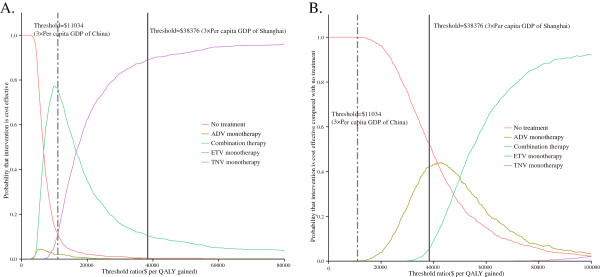
Results: In LAM-resistant HBeAg-positive and HBeAg-negative CHB cohorts, TDF monotherapy and combination therapy were on the efficiency frontier for both positive and negative populations. Compared with no treatment, the use of combination therapy cost an additional $6,531.7 to gain 1 additional quality-adjusted life year (QALY) for HBeAg-positive patients and $4,571.7 to gain 1 additional QALY for HBeAg-negative patients. TDF monotherapy for HBeAg-positive patients, shows greater increase in QALYs but higher incremental cost-effectiveness ratio (ICER) in comparison with combination therapy. In probabilistic sensitivity analyses, combination therapy was the preferred option for health care systems with limited health resources, such as Chinese health care system.
Conclusion: In Chinese patients with LAM-resistant CHB, combination therapy is a more cost-effective option than the competing rescue therapies.
Figures
Similar articles
-
Cost-effectiveness comparison of lamivudine plus adefovir combination treatment and nucleos(t)ide analog monotherapies in Chinese chronic hepatitis B patients.Drug Des Devel Ther. 2016 Mar 1;10:897-910. doi: 10.2147/DDDT.S98200. eCollection 2016. Drug Des Devel Ther. 2016. PMID: 27041994 Free PMC article.
-
Tenofovir vs lamivudine plus adefovir in chronic hepatitis B: TENOSIMP-B study.World J Gastroenterol. 2017 Nov 7;23(41):7459-7469. doi: 10.3748/wjg.v23.i41.7459. World J Gastroenterol. 2017. PMID: 29151700 Free PMC article. Clinical Trial.
-
Cost-effectiveness analysis of tenofovir disoproxil fumarate for treatment of chronic hepatitis B in China.Hepatol Int. 2016 Nov;10(6):924-936. doi: 10.1007/s12072-016-9741-6. Epub 2016 Jun 7. Hepatol Int. 2016. PMID: 27271357
-
A systematic review and economic evaluation of adefovir dipivoxil and pegylated interferon-alpha-2a for the treatment of chronic hepatitis B.J Viral Hepat. 2007 Feb;14(2):75-88. doi: 10.1111/j.1365-2893.2006.00808.x. J Viral Hepat. 2007. PMID: 17244247
-
Efficacy and cost-effectiveness of antiviral regimens for entecavir-resistant hepatitis B: A systematic review and network meta-analysis.Hepatobiliary Pancreat Dis Int. 2020 Dec;19(6):507-514. doi: 10.1016/j.hbpd.2020.09.007. Epub 2020 Sep 29. Hepatobiliary Pancreat Dis Int. 2020. PMID: 33051132
Cited by
-
Telbivudine for the treatment of chronic hepatitis B in HBeAg-positive patients in China: a health economic analysis.Springerplus. 2016 Oct 5;5(1):1719. doi: 10.1186/s40064-016-3404-x. eCollection 2016. Springerplus. 2016. PMID: 27777855 Free PMC article.
-
Cost-Effectiveness of Peg-Interferon, Interferon and Oral Nucleoside Analogues in the Treatment of Chronic Hepatitis B and D Infections in China.Clin Drug Investig. 2016 Aug;36(8):637-48. doi: 10.1007/s40261-016-0409-8. Clin Drug Investig. 2016. PMID: 27166628
-
Quality of Health Economic Evaluations in Mainland China: A Comparison of Peer-Reviewed Articles in Chinese and in English.Appl Health Econ Health Policy. 2022 Jan;20(1):35-54. doi: 10.1007/s40258-021-00674-0. Epub 2021 Jul 29. Appl Health Econ Health Policy. 2022. PMID: 34322862
-
Quality of pharmacoeconomic research in China: A systematic review.Medicine (Baltimore). 2016 Oct;95(41):e5114. doi: 10.1097/MD.0000000000005114. Medicine (Baltimore). 2016. PMID: 27741131 Free PMC article.
-
Efficacy and resistance in de novo combination lamivudine and adefovir dipivoxil therapy versus entecavir monotherapy for the treatment-naive patients with chronic hepatitis B: a meta-analysis.Virol J. 2014 Mar 28;11:59. doi: 10.1186/1743-422X-11-59. Virol J. 2014. PMID: 24673792 Free PMC article. Review.
References
-
- Sorrell MF, Belongia EA, Costa J, Gareen IF, Grem JL, Inadomi JM, Kern ER, McHugh JA, Petersen GM, Rein MF. et al.National Institutes of Health Consensus Development Conference Statement: management of hepatitis B. Ann Intern Med. 2009;150(2):104–110. - PubMed
-
- Dienstag JL. Benefits and risks of nucleoside analog therapy for hepatitis B. Hepatology. 2009;49(5 Suppl):S112–S121. - PubMed
Publication types
MeSH terms
Substances
LinkOut - more resources
Full Text Sources
