Review
. 2012 Sep-Dec;49(5-6):199-217.
doi: 10.3109/10408363.2012.738808. Epub 2012 Nov 9.

DNA damage signaling assessed in individual cells in relation to the cell cycle phase and induction of apoptosis

Affiliations
Review

DNA damage signaling assessed in individual cells in relation to the cell cycle phase and induction of apoptosis

Zbigniew Darzynkiewicz et al. Crit Rev Clin Lab Sci. 2012 Sep-Dec.

Abstract

Reviewed are the phosphorylation events reporting activation of protein kinases and the key substrates critical for the DNA damage signaling (DDS). These DDS events are detected immunocytochemically using phospho-specific Abs; flow cytometry or image-assisted cytometry provide the means to quantitatively assess them on a cell by cell basis. The multiparameter analysis of the data is used to correlate these events with each other and relate to the cell cycle phase, DNA replication and induction of apoptosis. Expression of γH2AX as a possible marker of induction of DNA double strand breaks is the most widely studied event of DDS. Reviewed are applications of this multiparameter approach to investigate constitutive DDS reporting DNA damage by endogenous oxidants byproducts of oxidative phosphorylation. Also reviewed are its applications to detect and explore mechanisms of DDS induced by variety of exogenous agents targeting DNA such as exogenous oxidants, ionizing radiation, radiomimetic drugs, UV light, DNA topoisomerase I and II inhibitors, DNA crosslinking drugs and variety of environmental genotoxins. Analysis of DDS induced by these agents provides often a wealth of information about mechanism of induction and the type of DNA damage (lesion) and is reviewed in the context of cell cycle phase specificity, DNA replication, and induction of apoptosis or cell senescence. Critically assessed is interpretation of the data as to whether the observed DDS events report induction of a particular type of DNA lesion.


Figures

Fig. 1
Fig. 1. The ATM signaling pathway triggered by induction of DSBs.
Induction of DSB leads to lessening of torsional strain and unwinding of DNA superhelical structure which triggers local decondensation of chromatin and recruits the MRE11, RAD50 and NBS1 proteins (MRN complex), as well as BRCA1 to the DSB site (A, dashed arrows). These events activate ATM which occurs by autophosphorylation of Ser1981 and leads to dissociation of the ATM dimer onto two monomers that have enzymatic activity. Activated ATM is then recruited to the site of the DSB (B, dashed arrow) where it phosphorylates several substrates including NBS1, BRCA1 and SMC1 (C). NBS1 phosphorylation is required for targeting ATM to phosphorylate Chk1 and Chk2. Phosphorylation of SMC1 activates S-phase checkpoints whereas BRCA1 phosphorylation engages this protein in the DSB repair pathway. ATM also phosphorylates E2F1, Chk1, p53, Mdm2, Chk2, and H2AX and several other substrates. Activated p53 (phosphorylated on Ser 15) induces transcription of p21WAF1 and/or Bax genes whose protein products arrest cells in G1 or promote apoptosis, respectively.
Fig. 2
Fig. 2. Activation of Chk2 and Chk2’s major substrates.
DNA damage (induction of DSBs) triggers activation of ATM (Fig 1) which in turn phosphorylates Chk2 on Thr68 causing its dimerization. In response to replication stress rather than DSB Chk2 can be phosphorylated by ATR. Within the dimer Chk2 is further phosphorylated at Thr383, Thr387 and Ser516 which leads to its dissociation onto monomers. Both multi-phosphorylated dimers and monomers are enzymatically active and able to phosphorylate the downstream substrates. Among these substrates are the Cdc25C and Cdc25A phosphatases whose phosphorylation by Chk2 promotes binding to a 14-3-3 protein thereby preventing translocation into the nucleus and dephosphorylation of inhibitory phosphorylation at Thr14 and Tyr15 on cyclin/CDK complexes. This halts cell cycle transitions from G2 to M (Cdc25C) and G1 to S, (Cdc25A) respectively. Phosphorylation of Cdc25 phosphatases also accelerates their proteasomal degradation. A redundant mechanism of cell arrest in G1 involves phosphorylation of p53 by Chk2 which may lead to upregulation of the cdk2 inhibitor p21CIP1/WAF1. Phosphorylation of p53 may also result in upregulation of the pro-apoptotic protein Bax. Apoptosis may additionally be promoted by phosphorylation of PML and E2F-1. Phosphorylation of BRCA1 engages it in the DNA repair pathway.
Fig. 3
Fig. 3. Attenuation of constitutive expression of γH2AX by treatment with the ROS scavenger N-acetyl-L-cysteine (NAC) (A) and by hypoxia (B)
A. The bivariate (DNA content versus γH2AX IF) distributions show a decrease in the level of constitutive expression of γH2AX in TK6 lymphoblastoid cells growing in the presence of 10 or 50 mM NAC, added into cultures for 1 h prior to cell harvesting, compared to the untreated cells (Ctrl). The percent decline in mean values of γH2AX IF of G1, S and G2M phase cell subpopulations in cultures treated with NAC in relation to the respective subpopulations of the untreated (Ctrl) cells are shown above the respective arrows. The inset in the left panel shows the DNA content frequency histogram representative of the cells in these cultures. The right panel shows the plot of the mean values of γH2AX IF for G1, S and G2M cells, established by gating analysis, in relation to NAC concentration. Because the level of constitutive expression of γH2AX (or ATM-S1981P) is relatively low, compared with the level seen after treatment with DNA damaging agents (e.g. Fig. 4) the γH2AX IF measurements have been carried out at higher sensitivity (higher voltage) of the photomultiplier. B. Constitutive expression of γH2AX in WI-38 cells growing in 21% concentration of O2 (a), and 3% concentration of O2 for 24 (b) and 48 h (c)..
Fig. 4
Fig. 4. Correlation between DNA replication and induction of γH2AX in A549 cells treated with H2O2
A: Incorporation of EdU by untreated cells during 120 min exposure to EdU. The cells which during the duration of 120 EdU pulse were entering (en-S) or exiting (ex-S) S phase show variable level of EdU incorporation as the interval of their exposure to the precursor at the time of DNA replication varied; the mid-S phase cells show maximal EdU incorporation. .B. The cells were initially treated with EdU for 60 min and then, still in the presence of EdU, were exposed to 200 µM H2O2 for an additional 60 min. Note a decline in EdU incorporation compared to A. For the “paint-a-gate” multiparameter analysis the cells incorporating EdU (above the threshold marked by the dashed line), were electronically colored red. C. Constitutive expression of γH2AX in untreated (control) cells; the skewed dashed line shows the upper threshold of γH2AX expression for 97% of G1 and S-phase cells. D. Cells were treated as in B, the EdU incorporating cells are colored red. Note the increased expression of γH2AX (compared with C) predominantly in DNA replicating cells. E. Bivariate (EdU vs γH2AX) distribution shows a correlation between incorporation of EdU and expression of γH2AX. The EdU negative cells expressing γH2AX (arrow) are predominantly G2M cells that show increased level of constitutive DNA damage signaling.
Fig. 5
Fig. 5. Correlation between induction of H2AX by Cpt, Mxt, and Etp and DNA replication in A549 cells
Exponentially growing A549 cells were exposed to EdU for 30 min and then (still in the presence of EdU) were treated either with Cpt (D, E, F), Mxt (G, H, I), or Etp (J, K, L) for 2 h. Control cells (A—C) were exposed only to EdU for 2.5 h. The cells were then fixed and their blue (DAPI), green (EdU), and red (γH2AX) fluorescence were measured by LSC. The cells that incorporated EdU were “paint-gated’ (red) and the data were plotted as bivariate distributions representing γH2AX versus DNA content (B, E, H, K) or γH2AX versus EdU incorporation (C, F, I, L). Note that Cpt induced γH2AX only in EdU incorporating cells. The very few EdU-negative cells expressing γH2AX, marked by the arrows, (F) are predominantly G2M cells constitutively expressing γH2AX (C). In contrast, in response to treatment with Mxt or Etp, H2AX was phosphorylated in both EdU incorporating and non-incorporating (G1 and G2M) cells. A correlation between EdU incorporation and induction of cH2AX by the Top inhibitors is shown in Panels F, I, and L; the correlation coefficient refers only to DNA replicating cells. Unlike in the case of Cpt-treatment, there are numerous EdU-negative cells expressing γH2AX following exposure to Mxt or Etp (I, L, marked by arrows). Insets in A, D, G, and J panels present DNA content frequency histograms from the respective cultures, with EdU incorporating cells marked in red. The dashed skewed lines in B, E, H, and K show the upper threshold for 97% of G1 and S-phase cells expressing γH2AX in the untreated culture (Ctrl).
Fig. 6
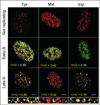
Fig. 6. Spatial relationship in chromatin between the sites of EdU incorporation (“replication factories”) and the induction of γH2AX foci in A549 cells treated with Tpt, Mxt or Etp
Confocal images of A549 nuclei that were briefly (30 min) exposed to EdU and then for additional 60 min treated with Tpt, Mxt, or Etp as described in detail elsewhere. The incorporation of EdU was detected utilizing AlexaFluor 488-tagged azide (green fluorescence) while γH2AX was detected using a secondary Ab labeled with AlexaFluor 568 (red fluorescence), as in Fig. 5.The size marker = 10µm. The top row shows nuclei of cells not incorporating EdU, the mid row - nuclei of cells in early-S phase, the bottom - nuclei of late-S phase. The distinction between early- and late-S phases is based on the characteristic differences in the pattern of DNA replication sites. Enlarged images of selected foci/sites of DNA replication (late-S phase) are shown at the bottom of the respective columns; the size marker = 0.5 µM. The fraction of DNA replication sites that co-localize with γH2AX foci (yellow fluorescence) is shown in each panel.
Fig. 7
Fig. 7. Induction of γH2AX in A549 cells after their exposure to cigarette smoke
A. Bivariate (DNA content versus γH2AX) distributions representing mock-treated (Ctrl), cells exposed to smoke from standard tobacco cigarette (2R4F) (TCS), or smoke from tobacco-free (Bravo) cigarette (NTCS). A549 cells were exposed to the smoke for 10 min and the induction of γH2AX was assessed 1 h after the exposure. The skewed dashed line shows the top level of γH2AX expression for 97% cells from Ctrl culture. B. Reduction of the cigarette smoke induced γH2AX in A549 cells by co-treatment with the radicals’ scavenger n-acetyl-L-cysteine (NAC); p<0.01 marked by asterisks.
Fig. 8
Fig. 8. Correlation between induction of γH2AX, activation of caspase-3, and cell cycle phase of HL-60 cells treated with Tpt for 3 h
After 3 h of treatment with Tpt some cells (predominantly in S phase) undergo apoptosis. Apoptotic cells (Ap) show an order of magnitude higher intensity of γH2AX phospho-specific IF compared with non-apoptotic cells. The caspase-3 versus γH2AX bivariate distributions (right panels) reveal that some non-apoptotic (caspase-3 negative) cells have elevated expression of γH2AX reflecting the presence to the Tpt-induced primary DSBs (pDSBs).

Similar articles

Cited by

References

    1. Bakkenist CJ, Kastan MB. DNA damage activates ATM through intermolecular autophosphorylation and dimer dissociation. Nature. 2003;421:499–506. - PubMed
    1. Bakkenist CJ, Kastan MB. Initiating cellular stress responses. Cell. 2004;118:9–17. - PubMed
    1. Bonner WM, Redon CE, Dickey JS, Nakamura AJ, Sedelnikova OA, Solier S, Pommier Y. γH2AX and cancer. Nat. Rev. Cancer. 2008;8:957–966. - PMC - PubMed
    1. Helt CE, Cliby WA, Keng PC, Bambara RA, O’Reilly MA. Ataxia telangiectasia mutated (ATM) and ATM and Rad3-related protein exhibit selective target specificities in response to different forms of DNA damage. J. Biol. Chem. 2005;280:1186–1192. - PubMed
    1. Kastan MB. DNA damage responses: Mechanisms and roles in human disease. 2007 G.H.A. Cloves Memorial Award Lecture. Mol Cancer Res. 2008;6:517–524. - PubMed

Publication types