. 2012 Nov 8:12:509.
doi: 10.1186/1471-2407-12-509.

Increased frequency of single base substitutions in a population of transcripts expressed in cancer cells

Affiliations

Increased frequency of single base substitutions in a population of transcripts expressed in cancer cells

Laurent Bianchetti et al. BMC Cancer. .

Abstract

Background: Single Base Substitutions (SBS) that alter transcripts expressed in cancer originate from somatic mutations. However, recent studies report SBS in transcripts that are not supported by the genomic DNA of tumor cells.

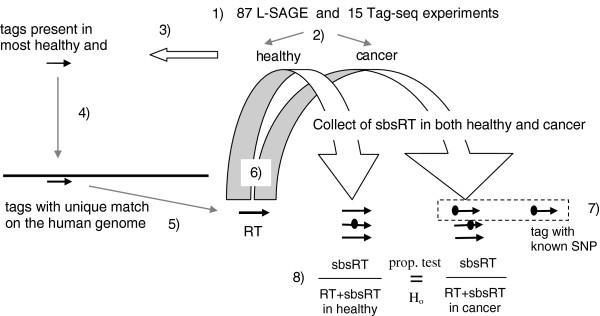
Methods: We used sequence based whole genome expression profiling, namely Long-SAGE (L-SAGE) and Tag-seq (a combination of L-SAGE and deep sequencing), and computational methods to identify transcripts with greater SBS frequencies in cancer. Millions of tags produced by 40 healthy and 47 cancer L-SAGE experiments were compared to 1,959 Reference Tags (RT), i.e. tags matching the human genome exactly once. Similarly, tens of millions of tags produced by 7 healthy and 8 cancer Tag-seq experiments were compared to 8,572 RT. For each transcript, SBS frequencies in healthy and cancer cells were statistically tested for equality.

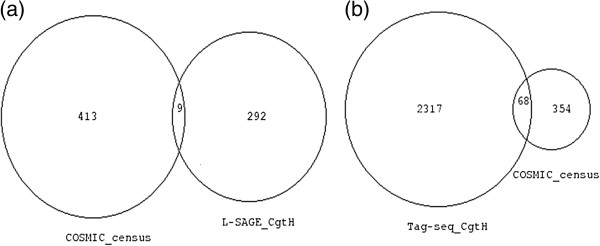
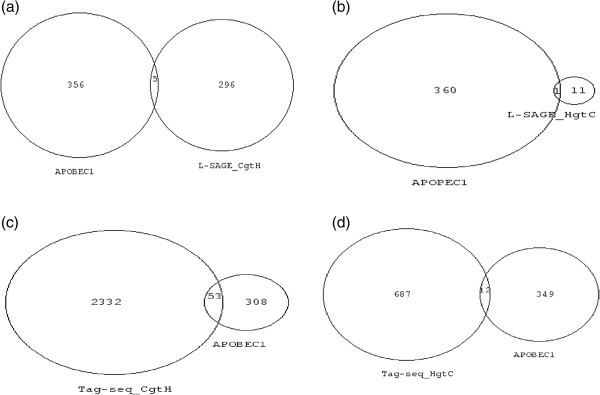
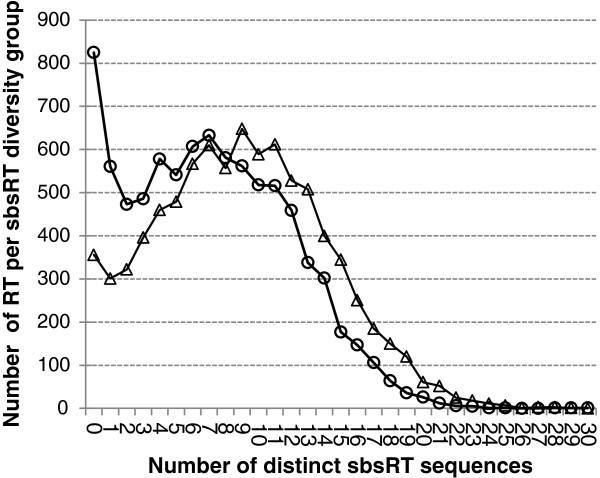
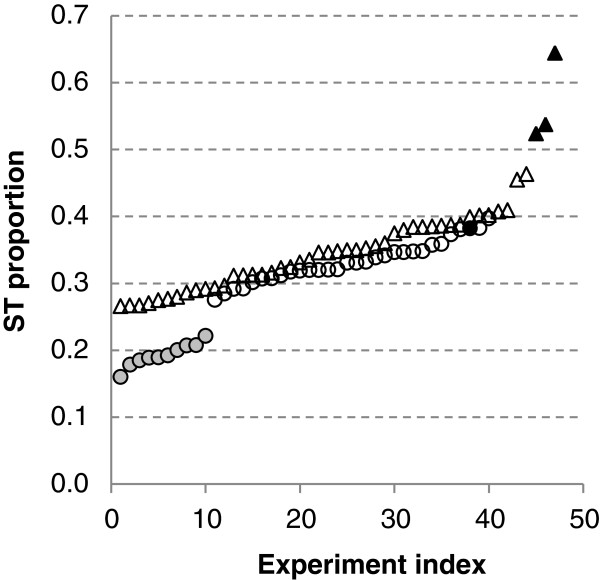
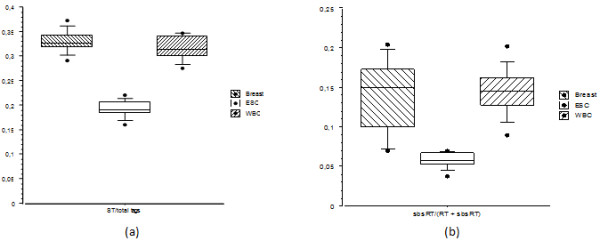
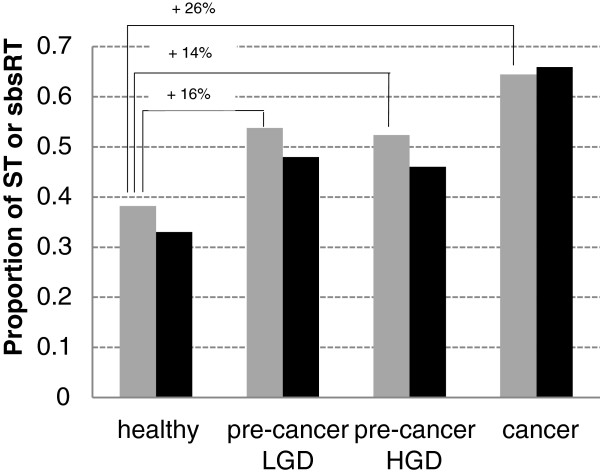
Results: In the L-SAGE and Tag-seq experiments, 372 and 4,289 transcripts respectively, showed greater SBS frequencies in cancer. Increased SBS frequencies could not be attributed to known Single Nucleotide Polymorphisms (SNP), catalogued somatic mutations or RNA-editing enzymes. Hypothesizing that Single Tags (ST), i.e. tags sequenced only once, were indicators of SBS, we observed that ST proportions were heterogeneously distributed across Embryonic Stem Cells (ESC), healthy differentiated and cancer cells. ESC had the lowest ST proportions, whereas cancer cells had the greatest. Finally, in a series of experiments carried out on a single patient at 1 healthy and 3 consecutive tumor stages, we could show that SBS frequencies increased during cancer progression.

Conclusion: If the mechanisms generating the base substitutions could be known, increased SBS frequency in transcripts would be a new useful biomarker of cancer. With the reduction of sequencing cost, sequence based whole genome expression profiling could be used to characterize increased SBS frequency in patient's tumor and aid diagnostic.


Figures

Figure 1
Figure 1
Bioinformatics workflow. 1) L-SAGE and Tag-seq experiments were processed separately 2) Experiments were divided in 2 groups, namely healthy and cancer 3) tags (thin black arrow) present in at least k% of healthy and at least k% of cancer experiments (k = 75% for L-SAGE and k = 90% for Tag-seq) were selected 4) The tags 5' boundaries were extended with the CATG (NlaIII) motif generating 4 + 17 = 21 base sequences and aligned on the human genome (long and thick black line) using blastn 5) tags matching the human genome exactly once were selected as RT (thick black arrow) 6) For each RT, sbsRT (thick black arrows carrying an ellipse) were searched among all the tags and were collected with their counts. 7) sbsRT matching a known SNP were excluded from SBS accounting (discontinuous rectangle) 8) For each RT, i.e. for each transcript, 2 proportions of sbsRT were calculated, i.e. 1 in healthy and 1 in cancer. Finally, both proportions were statistically tested for equality.
Figure 2
Figure 2
Venn diagrams of transcripts with greater SBS frequencies and genes with cancer somatic mutations. Numbers represent NCBI gene ID. Venn diagram areas are proportional to gene ID numbers. (a) Left circle = COSMIC (v56) census of 422 somatically mutated genes in cancer, right circle = transcripts with greater SBS frequencies in cancer than in healthy cells in L-SAGE experiments. Nine transcripts were common to both lists. For each of these 9 transcripts, no known cancer-related somatic mutations altered the 17 base NlaIII tag. (b) Right circle = COSMIC (v56) census of 422 somatically mutated genes in cancer. Left circle = transcripts with greater SBS frequencies in cancer than in healthy cells in Tag-seq experiments. Sixty eight transcripts were common to both lists. For each of these 68 transcripts, no known cancer related somatic mutations altered the 17 base NlaIII tag.
Figure 3
Figure 3
Venn diagrams of transcripts with greater SBS frequencies and APOBEC1 RNA-editing targets. Numbers represent NCBI gene ID. Venn diagram areas are proportional to gene ID numbers. (a) Left circle = APOBEC1 RNA-editing targets, right circle = transcripts with greater SBS frequencies in cancer cells in L-SAGE experiments. (b) Left circle = APOBEC1 RNA-editing targets, right circle = transcripts with greater SBS frequencies in healthy cells in L-SAGE experiments. (c) Right circle = APOBEC1 RNA-editing targets, left circle = transcripts with greater SBS frequencies in cancer cells in Tag-seq experiments. (d) Right circle = APOBEC1 RNA-editing targets, left circle = transcripts with greater SBS frequencies in healthy cells in Tag-seq experiments.
Figure 4
Figure 4
Diversity of sbsRT in healthy and cancer cells. SBS were tracked for 8,572 RT in 7 healthy (circles) and 8 cancer (triangles) Tag-seq experiments. The 8,572 RT were distributed into sequence diversity groups according to the number of distinct sbsRT sequences. For example, group 0, i.e. RT for which 0 sbsRT were observed, contained approximately 350 RT in cancer and slightly more than 800 RT in healthy cells. RT associated with more than 30 distinct sbsRT were rare.
Figure 5
Figure 5
ST proportions calculated for each L-SAGE experiment. Each symbol represents 1 experiment: 47 cancer (triangles) and 40 healthy (circles), circles filled with gray = ESC, triangles filled with black = L-SAGE experiments carried out on the tumor cells of a single patient, circle filled with black = L-SAGE experiment carried out on the healthy cells of the same patient. Experiments were sorted in ascending ST proportion order.
Figure 6
Figure 6
Distribution of ST proportions and global sbsRT proportions in 3 distinct healthy tissues. 32 L-SAGE experiments were used, namely "Breast" (12 experiments), "ESC" (10 experiments) and "White Blood Cells" (WBC) (10 experiments). For each experiment, the (a) ST proportion and the (b) global sbsRT proportion were calculated. 583 RT were used for Breast, 1.478 for ESC, and 860 for WBC to calculate the global sbsRT proportion, respectively.
Figure 7
Figure 7
Single patient personalized monitoring of ST and global sbsRT proportions during disease progression. ST and global sbsRT proportions were calculated for 4 L-SAGE experiments carried out on the biopsies of a single patient at 1 healthy and 3 consecutive tumor stages. Gray bars = ST proportions, black bars = global sbsRT proportions. Low-grade dysplasia (LGD), High-grade dysplasia (HGD) and adenocarcinoma (cancer). The global sbsRT proportions were calculated using 1.435 RT present in all 4 experiments. Significance of ST proportion differences between healthy, LGD, HGD and adenocarcinoma was calculated using the Pearson’s chi-squared proportion test (p-value < 2.2 x 10⁻¹⁶).

Similar articles

References

    1. Vogelstein B, Kinzler KW. Cancer genes and the pathways they control. Nat. 2004;10(8):789–799. doi: 10.1038/nm1087. - DOI - PubMed
    1. McCulloch SD, Kunkel TA. The fidelity of DNA synthesis by eukaryotic replicative and translesion synthesis polymerases. Cell Res. 2008;18(1):148–161. doi: 10.1038/cr.2008.4. - DOI - PMC - PubMed
    1. Alic N, Ayoub N, Landrieux E, Favry E, Baudouin-Cornu P, Riva M, Carles C. Selectivity and proofreading both contribute significantly to the fidelity of RNA polymerase III transcription. Proc. Natl. Acad. Sci. USA. 2007;104(25):10400–10405. doi: 10.1073/pnas.0704116104. - DOI - PMC - PubMed
    1. The International SNP Map Working Group. A map of human genome sequence variation containing 1.42 million single nucleotide polymorphisms. Nature. 2001;409:928–933. doi: 10.1038/35057149. - DOI - PubMed
    1. Kevanon K, Eisenberg E, Rechavi G, Levanon EY. Letter from the editor: adenosine-to-inosine RNA editing in Alu repeats in the human genome. EMBO reports. 2005;6(9):831–835. doi: 10.1038/sj.embor.7400507. - DOI - PMC - PubMed

Publication types

LinkOut - more resources