. 2012 Nov;30(11):1072-80.
doi: 10.1038/nbt.2419.

Protein structure prediction from sequence variation

Affiliations

Protein structure prediction from sequence variation

Debora S Marks et al. Nat Biotechnol. 2012 Nov.

Abstract

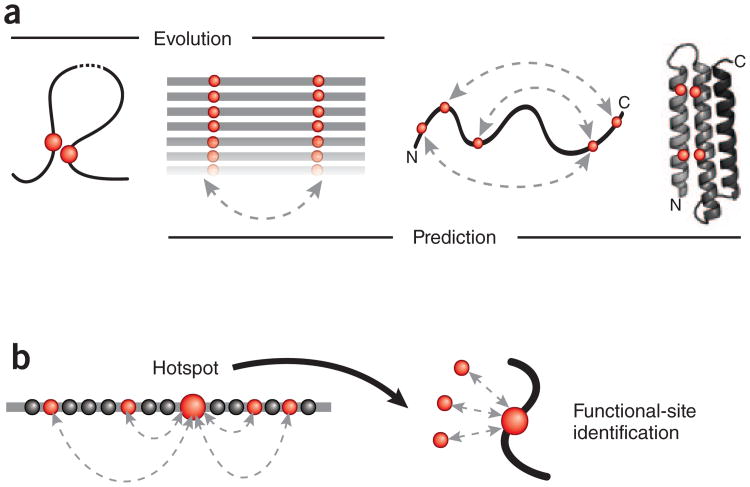
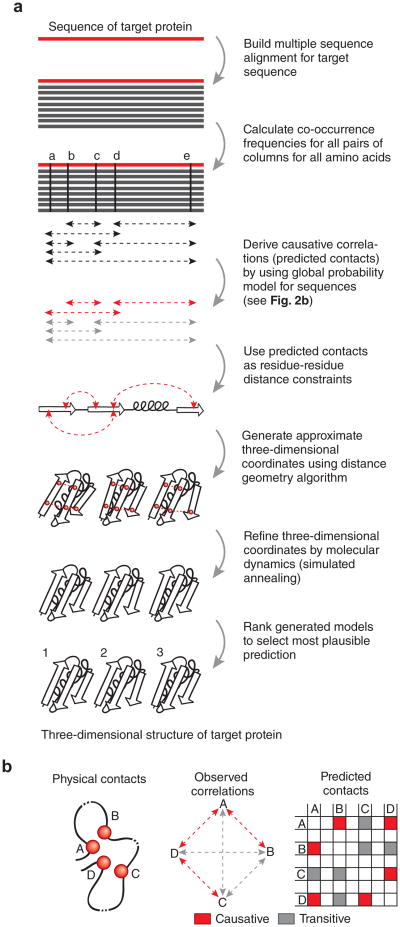
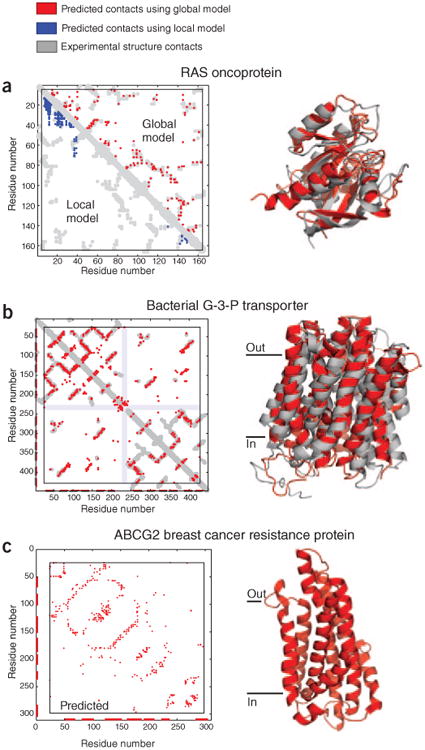
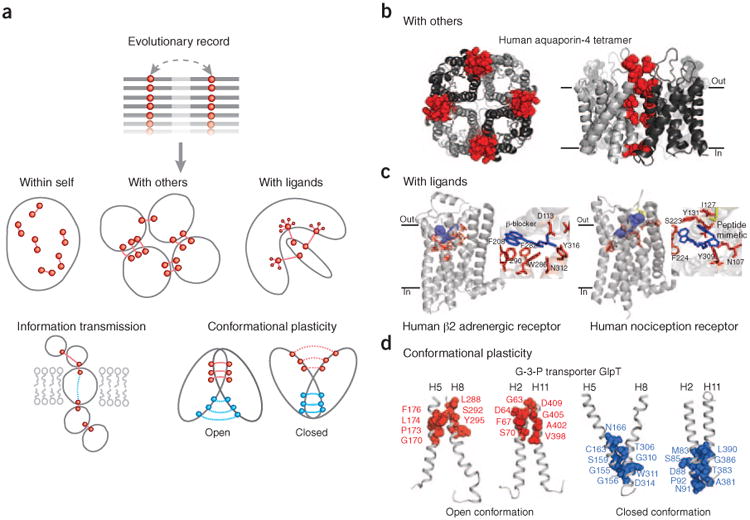
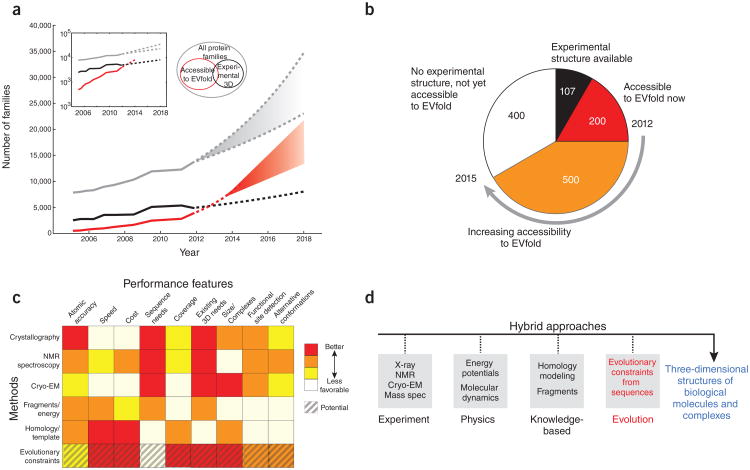
Genomic sequences contain rich evolutionary information about functional constraints on macromolecules such as proteins. This information can be efficiently mined to detect evolutionary couplings between residues in proteins and address the long-standing challenge to compute protein three-dimensional structures from amino acid sequences. Substantial progress has recently been made on this problem owing to the explosive growth in available sequences and the application of global statistical methods. In addition to three-dimensional structure, the improved understanding of covariation may help identify functional residues involved in ligand binding, protein-complex formation and conformational changes. We expect computation of covariation patterns to complement experimental structural biology in elucidating the full spectrum of protein structures, their functional interactions and evolutionary dynamics.


Figures

Figure 1
Figure 1
Reading the sequence record for evolutionary constraints. (a) Evolutionary pressure (left) to maintain favorable interactions between physically interacting amino acid residues (red circles) in the three-dimensional fold of a protein (curved line) leaves a visible record of residue covariation (double-headed, dashed arrow) in related protein sequences (aligned horizontal lines). The inverse problem of inferring (right) directly causative residue couplings (evolutionary couplings) from the covariation record is challenging because of transitive correlations and other confounding effects, but once evolutionary couplings are determined (double-headed dashed arrows on curved protein chain), they can be used to predict the unknown three-dimensional structure of a protein (ribbon, right) from a set of sequences alone. (b) Residues subject to a high number of evolutionary pair constraints (double-headed, dashed arrows; left) represent likely functional hotspots (large red dot). Such highly constrained residues include residues in functional sites (for example, interaction with external ligands, red dots on right) that may not be detectable by analysis of single-residue conservation.
Figure 2
Figure 2
Deriving folded three-dimensional structure for a target protein sequence. (a) Workflow as implemented on the publicly available web server EVfold.org. Related methods (Table 1) follow similar steps, but details differ. The amino acid sequence of the target protein is used to perform a database search for putative structural homologs, with attention to the optimal cutoff in sequence similarity so that sufficient sequences are available yet they are not too far diverged to lose subfamily specificity. Minimally, hundreds of sequences are needed to derive plausible causative evolutionary couplings. For ten candidate structures for a medium-sized protein (∼200 residues), the computation takes less than an hour on a typical laptop computer. (b) The principal confounding effect dealt with by global probability models, but not by the local models, is that of transitive (indirect) correlations that do not reflect causative evolutionary constraints on interactions. For example, correlations between residues A and B, residues A and D, and residues D and C are causative because they reflect direct interactions, whereas residues A and C show transitive correlation owing to their mutual direct interactions with residue D. The transitive correlations, in special cases, can have numerically stronger correlation values than causative correlation, for example, if two noninteracting residues have in common several neighbors, thereby confounding structure prediction.
Figure 3
Figure 3
High-ranking evolutionary constraints correspond well to experimental structure contacts in blinded tests, encouraging prediction of unknown structures. (a) Blinded prediction test for a globular protein. Dots in plots on left represent contacts between residues in a protein. Residue pairs with high coevolution scores from local models based on mutual information are mostly not close in three dimensions (blue dots), whereas high-ranking evolutionary constraints (red dots) correspond well to experimental structure contacts (gray). The same number of predictions are shown in each triangle (same number of blue and red dots). The high accuracy of prediction of evolutionary constraints allows the prediction of the all-atom three-dimensional structures of globular proteins, shown as a ribbon diagram of the human oncoprotein RAS (red, evolutionary coupling–based prediction; gray, crystal structure; Uniprot identifier RASH_HUMAN; PDB identifier 5p21). (b) Blinded prediction test as in a for a transmembrane protein (Uniprot identifier GLPT_ECOLI; PDB identifier, 1pw4 (ref. 22). (c) Example of prediction of a medically important protein of unknown three-dimensional structure, ATP-binding cassette sub-family G member 2 (alias, breast cancer resistance protein, Uniprot identifier ABCG2_HUMAN).
Figure 4
Figure 4
Beyond three-dimensional folds: predicting protein complexes and functional interactions. (a) Besides the prediction of monomer three-dimensional structure (‘within self’), in principle, evolutionary couplings can be used to deduce additional functional interactions (between a target protein and other proteins or ligands), the transmission of information and conformational plasticity. (b) Evolutionary constraints reflect the coevolution of residues in homomultimer interaction interfaces (red spheres, residues participating in interprotein evolutionary couplings; monomeric subunits, ribbons in different shades of gray), allowing the prediction of both tertiary and quaternary (oligomeric) structures from correlated mutations. (c) Residues (red sticks, predicted from summed evolutionary couplings) involved in ligand (blue sticks, position known in crystal structure) binding of transmembrane receptors are often affected by multiple high-ranking evolutionary constraints, which reflect the requirements of a particular spatial arrangement of binding residues, even in the presence of diverse ligand specificities in subfamilies. (d) In proteins with conformational plasticity, evolutionary constraints may reflect the proximity of residues in alternative conformations and can be used to fold structural models of the different states. Transmembrane helices H5-H8 H5 and H8, and H2 and H11, form two pairs that rock between the alternative conformations of the glycerol-3-phosphate transporter GlpT. The ‘closed conformation’ (closed to cytoplasm) was predicted by EVfold; the ‘open conformation’ is known from X-ray crystallography data (PDB identifier 1pw4).
Figure 5
Figure 5
Future applications. (a) Although experimental structure-determination in structural biology laboratories or structural genomics centers is highly productive (solid black line), it cannot keep up with the pace at which new protein families are being discovered by high-throughput sequencing (solid gray line). The number of three-dimensional structures that can be reasonably predicted using evolutionary conservation (solid red line) was estimated by a linear extrapolation in the log plot of the exponential growth inset. We expect the growth curves to saturate in the future (dashed lines), but there is no indication this will happen in the next couple of years, and indications are that a large increase in the number of protein families may be apparent from multispecies (metagenomic) sequencing. (b) Of the 1,250 alpha-helical transmembrane protein families known in mid-2012, 107 have solved experimental three-dimensional structures and another 200 are accessible to solution by evolutionary constraints in 2012. By 2015, we estimate an additional 500 of these 2012 families will become accessible to fold prediction by coevolution methods (Pfam numbers courtesy of J. Mistry and M. Punta). Similar extrapolations can be made for other protein structure classes, such as β-sheet transmembrane proteins or globular water-soluble proteins. (c) A comparison of methods for three-dimensional protein structure determination showing the complementary nature of various features from different approaches. ‘Sequence needs’ refers to the number of sequnces needed to solve the three-dimensional structure; ‘Existing 3D needs’ refers to the number of homologous sequences needed to solve structure. ‘Coverage’ refers to the ability to solve a large fraction of existing proteins given sufficient sequence information. Not included in our comparison matrix are large specialized hardware computational methods for protein structures such as Anton, which though providing insights into protein dynamics and folding are not yet easily reproducible. (d) Hybrid methods using all three computational approaches in c, with easier to produce experimental data, may greatly increase the number of protein structures and complexes, which are currently not in reach of experimental methods alone. EM, electron microscopy.

References

    1. Anfinsen CB. Principles that govern the folding of protein chains. Science. 1973;181:223–230. - PubMed
    1. Anfinsen CB. Some observations on the basic principles of design in protein molecules. Comp Biochem Physiol. 1962;4:229–240. - PubMed
    1. Sali A, Blundell TL. Comparative protein modelling by satisfaction of spatial restraints. J Mol Biol. 1993;234:779–815. - PubMed
    1. Pieper U, et al. ModBase, a database of annotated comparative protein structure models, and associated resources. Nucleic Acids Res. 2011;39:D465–D474. - PMC - PubMed
    1. Kryshtafovych A, Fidelis K, Moult J. CASP9 results compared to those of previous CASP experiments. Proteins. 2011;79(suppl. 10):196–207. - PMC - PubMed