. 2012 Dec 4;109(49):19971-6.
doi: 10.1073/pnas.1213933109. Epub 2012 Nov 8.

Unique motifs and hydrophobic interactions shape the binding of modified DNA ligands to protein targets

Affiliations

Unique motifs and hydrophobic interactions shape the binding of modified DNA ligands to protein targets

Douglas R Davies et al. Proc Natl Acad Sci U S A. .

Abstract

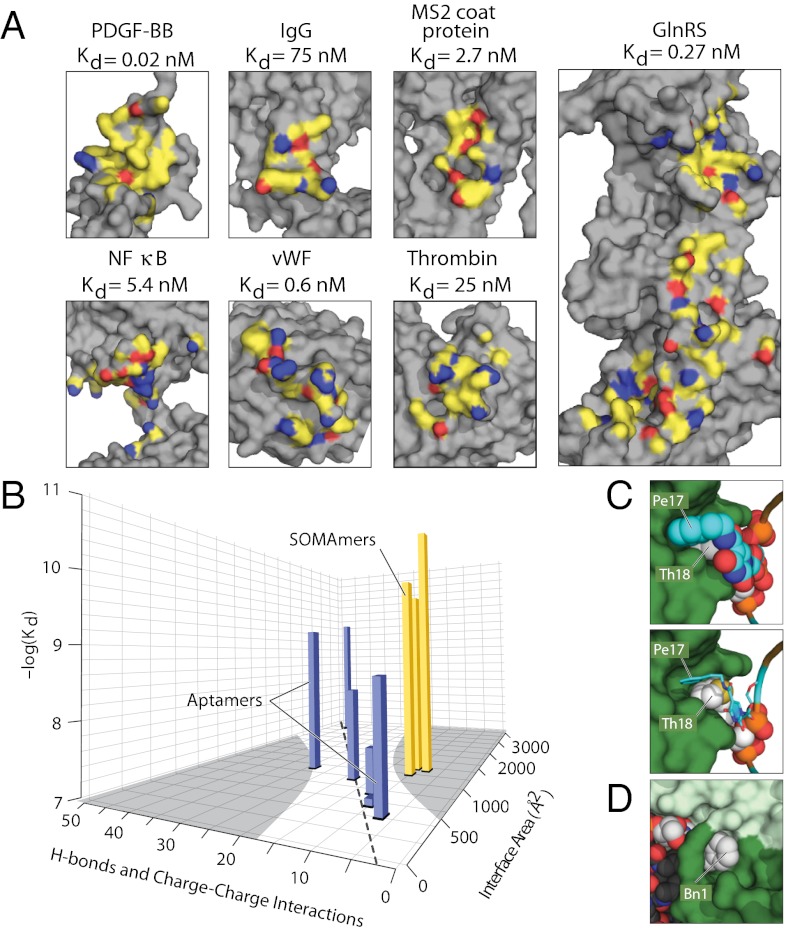
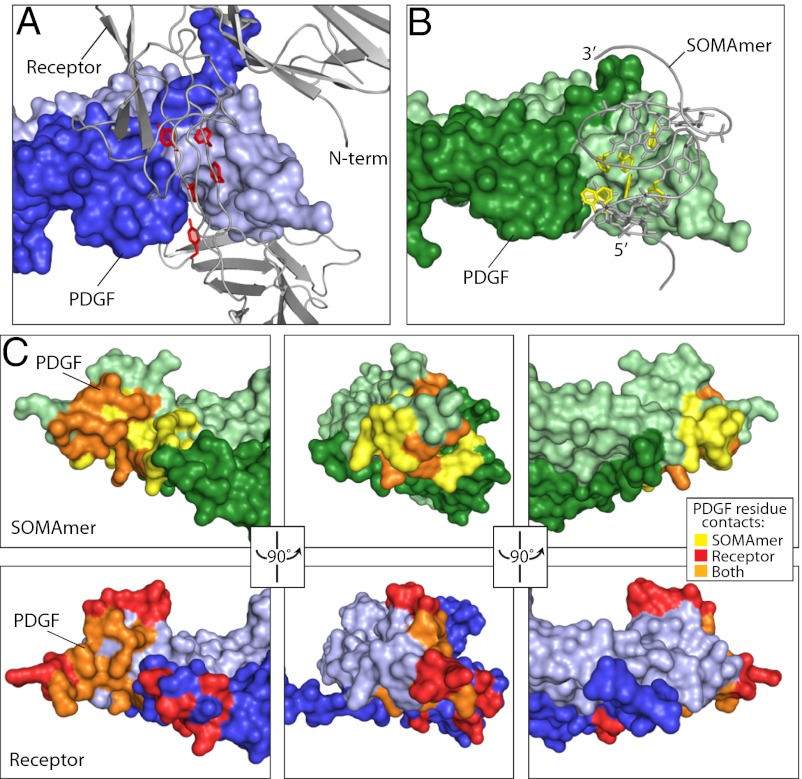
Selection of aptamers from nucleic acid libraries by in vitro evolution represents a powerful method of identifying high-affinity ligands for a broad range of molecular targets. Nevertheless, a sizeable fraction of proteins remain difficult targets due to inherently limited chemical diversity of nucleic acids. We have exploited synthetic nucleotide modifications that confer protein-like diversity on a nucleic acid scaffold, resulting in a new generation of binding reagents called SOMAmers (Slow Off-rate Modified Aptamers). Here we report a unique crystal structure of a SOMAmer bound to its target, platelet-derived growth factor B (PDGF-BB). The SOMAmer folds into a compact structure and exhibits a hydrophobic binding surface that mimics the interface between PDGF-BB and its receptor, contrasting sharply with mainly polar interactions seen in traditional protein-binding aptamers. The modified nucleotides circumvent the intrinsic diversity constraints of natural nucleic acids, thereby greatly expanding the structural vocabulary of nucleic acid ligands and considerably broadening the range of accessible protein targets.


Conflict of interest statement

Conflict of interest statement: D.R.D., A.B.B., T.E.E., and L.J.S. are employees and/or shareholders of Emerald BioStructures, Inc. A.D.G., C.Z., J.C.R., J.D.C., D.O., S.M.W., S.K.W., W.S.M., L.G., N.J., and T.C.J. are employees and/or shareholders of SomaLogic, Inc.

Figures

Fig. 1.
Fig. 1.
Optimization of PDGF-BB SOMAmer. (A) C3-linker substitution scanning is expressed as the ratio of Kd values (substituted/unsubstituted; top row) with each single C3 substitution compared with SL1. Kd ratios of >1 (red) and <1 (blue) denote a decrease or increase in binding affinity, respectively (see color scale bar in B). Sequences for several variants are shown, along with Kd values to PDGF-BB and PDGF-AB and the IC50 value in a cellular phosphorylation assay (Materials and Methods and Fig. S1). Structures of 5-modified dU residues are shown in B. (B) The eight Bn-dU residues in SL3 were systematically substituted with alternate 5-position modifications of dU, and Kd ratios (compared with SL3) for each substitution are expressed as described in A. Asterisk on dT denotes a direct link of the methyl group to the 5-position. A, dA; Bn, benzyl-dU; C, dC; G, dG; HEG, hexaethylene glycol; iB, isobutyl-dU; mA, 2’-O-methylA; mG, 2’-O-methylG; Pe, phenethyl-dU; Th, thiophene-dU.
Fig. 2.
Fig. 2.
SOMAmer structure overview. (A) PDGF-BB homodimer bound to SOMAmer SL5. Dark and light green are PDGF-B chains 1 and 2, respectively. SOMAmers are shown in gray, with modified nucleotides highlighted in purple. (B) Schematic representation of SL5 showing backbone trace and base pairing patterns seen in the cocrystal structure (Left; color scheme as in A; miniknot stem 1, orange box; miniknot stem 2, blue box; see Fig. 1B for structures). Base pairs are coded according to the nomenclature of Leontis and Westhof (48). Stick/cartoon view of SOMAmer SL5 with colors and approximate orientation to match the schematic on the left (Right).
Fig. 3.
Fig. 3.
Modified nucleotides facilitate unique structural features of the PDGF SOMAmer. (A) S1 and L2 side view. Color scheme for bases and backbone is as follows. Miniknot stem 1: Watson–Crick base pairs, orange; noncannonical base pair, cyan; loop 2, white; stem 2, blue; 5′ stem loop: Watson–Crick base pairs, gray; noncannonical base pair, pink. (B) Detail of noncanonical base pair between Pe-dU17 and Bn-dU20. (C) Axial view of S2. (D) Axial view of the 5′ stem domain highlights deviation from B-form DNA (Table S2). (E) Noncanonical base pair between Bn-dU2 and Bn-dU8. (F) Bn8 makes edge-to-face π-π interactions with Bn16 and Bn20 that define the topology of the interdomain junction. The effect of a single modified nucleotide substitution at the junction is evident in the space-filling images of SOMAmer SL5 (G) versus SL4, where iB8 group is shown in red (H).
Fig. 4.
Fig. 4.
Hydrophobic interactions dominate SOMAmer-target binding interface. (A) Interface contact atoms of PDGF in the SOMAmer cocrystal are compared with six currently available cocrystal structures for aptamer:target complexes with Kd values <500 nM (Fig. S8C). Noncontact atoms are colored gray, and atoms that make ≤4 Å contact with the nucleic acid ligand are colored yellow (nonpolar contacts), red (oxygen participating in a H-bond or salt bridge), or blue (nitrogen participating in a H-bond or salt bridge). (B) Plot of the number of polar contacts (hydrogen bonds plus charge–charge interactions) vs. contact surface area vs. reported binding affinities (also Fig. S8) for the six aptamer-target complexes (blue bars) and for three SOMAmers (yellow bars) including the PDGF:SL5 complex and two other SOMAmer:target structures. The area outside the 99% confidence interval for the polar contacts vs. contact surface area trendline defined by the six aptamers is indicated by gray shading on the floor of the figure. (C) Detailed view of shape complementarity of the PDGF:SOMAmer complex as exhibited by Pe-dU17 and Th-dU18 residues in space-filling representations (Left) or Pe-dU17 in stick representation revealing the contours of the thiophene ring of Th-dU18 (Right). PDGF chains 1 and 2 are shown as dark and light green surfaces, respectively. (D) Detail of Bn-dU1 interaction with PDGF.
Fig. 5.
Fig. 5.
Comparison of SL5 and PDGFRβ binding to PDGF-BB. (A) Receptor cocrystal showing PDGF homodimer (chain 1, dark blue; chain 2, light blue) and receptor extracellular domain colored gray (35), with aromatic rings of hydrophobic amino acids highlighted red. (B) Complex of PDGF homodimer (chain 1, dark green; chain 2, light green) and SL5 (gray), with aromatic rings of modified nucleotides highlighted yellow. (C) Comparison of SL5 and PDGFRβ binding footprints. PDGF is shown in three orientations as a surface representation, with residues that make 4 Å contact only with SL5 or PDGFRβ or both (“overlap” residues) shown in yellow, red, or orange, respectively.

References

    1. Tuerk C, Gold L. Systematic evolution of ligands by exponential enrichment: RNA ligands to bacteriophage T4 DNA polymerase. Science. 1990;249(4968):505–510. - PubMed
    1. Ellington AD, Szostak JW. In vitro selection of RNA molecules that bind specific ligands. Nature. 1990;346(6287):818–822. - PubMed
    1. Bunka DH, Stockley PG. Aptamers come of age - at last. Nat Rev Microbiol. 2006;4(8):588–596. - PubMed
    1. Patel DJ, Suri AK. Structure, recognition and discrimination in RNA aptamer complexes with cofactors, amino acids, drugs and aminoglycoside antibiotics. J Biotechnol. 2000;74(1):39–60. - PubMed
    1. Ghosh G, Huang DB, Huxford T. Molecular mimicry of the NF-kappaB DNA target site by a selected RNA aptamer. Curr Opin Struct Biol. 2004;14(1):21–27. - PubMed

MeSH terms

LinkOut - more resources