Stem cell transplantation increases antioxidant effects in diabetic mice
- PMID: 23139632
- PMCID: PMC3492792
- DOI: 10.7150/ijbs.4654
Stem cell transplantation increases antioxidant effects in diabetic mice
Abstract
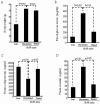
Intra bone marrow-bone marrow transplantation (IBM- BMT) + thymus transplantation (TT) has been shown to reduce the incidence of graft versus host disease (GVHD) and restore donor-derived T cell function. In addition, an increase in insulin sensitivity occurred in db/db mice after IBM-BMT+TT treatment. Heme oxygenase (HO)-1 is a stress inducible enzyme which exert antioxidant, antiapoptotic, and immune-modulating properties. We examined whether IBM-BMT+TT could modulate the expression of HO-1 in the kidneys of db/db mice. Six-week-old db/db mice with blood glucose levels higher than 250 mg/dl were treated with IBM-BMT+TT. Six weeks later, the db/db mice showed decreased body weight, blood glucose levels and insulin, and increased plasma adiponectin levels. The upregulation of HO-1 was associated with significantly (p<0.05) increased levels of peNOS and pAKT, but decreased levels of iNOS in the kidneys of db/db mice. Plasma creatinine levels also decreased (p<0.05), and the expression of type IV collagen was improved. Thus IBM-BMT+TT unregulated the expression of HO-1, peNOS and pAKT, while decreasing iNOS levels in the kidney of db/db mice. This was associated with an improvement in renal function.
Keywords: HO-1; IBM-BMT+TT; antioxidant; diabetic nephropathy..
Conflict of interest statement
Competing Interests: The authors have declared that no competing interest exists.
Figures


Similar articles
-
Successful modulation of type 2 diabetes in db/db mice with intra-bone marrow--bone marrow transplantation plus concurrent thymic transplantation.J Autoimmun. 2010 Dec;35(4):414-23. doi: 10.1016/j.jaut.2010.09.001. J Autoimmun. 2010. PMID: 20884174 Free PMC article.
-
Stem cell transplantation upregulates Sirt1 and antioxidant expression, ameliorating fatty liver in type 2 diabetic mice.Int J Biol Sci. 2015 Mar 19;11(4):472-81. doi: 10.7150/ijbs.10809. eCollection 2015. Int J Biol Sci. 2015. PMID: 25798066 Free PMC article.
-
Bone marrow stem cell transplant into intra-bone cavity prevents type 2 diabetes: role of heme oxygenase-adiponectin.J Autoimmun. 2008 May;30(3):128-35. doi: 10.1016/j.jaut.2007.12.005. J Autoimmun. 2008. PMID: 18243659
-
Apolipoprotein A-I mimetic peptide L-4F prevents myocardial and coronary dysfunction in diabetic mice.J Cell Biochem. 2011 Sep;112(9):2616-26. doi: 10.1002/jcb.23188. J Cell Biochem. 2011. PMID: 21598304 Free PMC article.
-
Bone marrow transplantation for autoimmune diseases.Acta Haematol. 1998;99(3):116-32. doi: 10.1159/000040826. Acta Haematol. 1998. PMID: 9587393 Review.
Cited by
-
Bone marrow stem cell as a potential treatment for diabetes.J Diabetes Res. 2013;2013:329596. doi: 10.1155/2013/329596. Epub 2013 Apr 10. J Diabetes Res. 2013. PMID: 23671865 Free PMC article.
-
Intractable diseases treated with intra-bone marrow-bone marrow transplantation.Front Cell Dev Biol. 2014 Sep 2;2:48. doi: 10.3389/fcell.2014.00048. eCollection 2014. Front Cell Dev Biol. 2014. PMID: 25364755 Free PMC article. Review.
-
Stem cell transplantation improves aging-related diseases.Front Cell Dev Biol. 2014 May 2;2:16. doi: 10.3389/fcell.2014.00016. eCollection 2014. Front Cell Dev Biol. 2014. PMID: 25364723 Free PMC article. Review.
-
Intra-iliac bone marrow injection as a novel alternative to intra-tibial inoculation in rat model.Stem Cell Res Ther. 2021 Jun 10;12(1):336. doi: 10.1186/s13287-021-02413-7. Stem Cell Res Ther. 2021. PMID: 34112243 Free PMC article.
-
Stem Cell Replacement Improves Expression of SMP30 in db/db Mice.Int J Mol Sci. 2015 Dec 16;16(12):29971-9. doi: 10.3390/ijms161226217. Int J Mol Sci. 2015. PMID: 26694363 Free PMC article.
References
-
- Otterbein LE, Soares MP, Yamashita K, Bach FH. Heme oxygenase-1: unleashing the protective properties of heme. Trends Immunol. 2003;24:449–55. - PubMed
-
- Orozco LD, Kapturczak MH, Barajas B, Wang X, Weinstein MM, Wong J. et al. Heme oxygenase-1 expression in macrophages plays a beneficial role in atherosclerosis. Circ Res. 2007;100:1703–11. - PubMed
-
- Goulmy E, Schipper R, Pool J, Blokland E, Falkenburg JH, Vossen J. et al. Mismatches of minor histocompatibility antigens between HLA-identical donors and recipients and the development of graft-versus-host disease after bone marrow transplantation. N Engl J Med. 1996;334:281–5. - PubMed
-
- Ikehara S. A novel strategy for allogeneic stem cell transplantation: perfusion method plus intra-bone marrow injection of stem cells. Exp Hematol. 2003;31:1142–6. - PubMed
-
- Nakamura K, Inaba M, Sugiura K, Yoshimura T, Kwon AH, Kamiyama Y. et al. Enhancement of allogeneic hematopoietic stem cell engraftment and prevention of GVHD by intra-bone marrow bone marrow transplantation plus donor lymphocyte infusion. Stem Cells. 2004;22:125–34. - PubMed
Publication types
MeSH terms
Substances
Grants and funding
LinkOut - more resources
Full Text Sources
Medical
Miscellaneous

