Adaptive evolution and the birth of CTCF binding sites in the Drosophila genome
- PMID: 23139640
- PMCID: PMC3491045
- DOI: 10.1371/journal.pbio.1001420
Adaptive evolution and the birth of CTCF binding sites in the Drosophila genome
Abstract
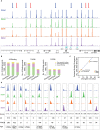
Changes in the physical interaction between cis-regulatory DNA sequences and proteins drive the evolution of gene expression. However, it has proven difficult to accurately quantify evolutionary rates of such binding change or to estimate the relative effects of selection and drift in shaping the binding evolution. Here we examine the genome-wide binding of CTCF in four species of Drosophila separated by between ∼2.5 and 25 million years. CTCF is a highly conserved protein known to be associated with insulator sequences in the genomes of human and Drosophila. Although the binding preference for CTCF is highly conserved, we find that CTCF binding itself is highly evolutionarily dynamic and has adaptively evolved. Between species, binding divergence increased linearly with evolutionary distance, and CTCF binding profiles are diverging rapidly at the rate of 2.22% per million years (Myr). At least 89 new CTCF binding sites have originated in the Drosophila melanogaster genome since the most recent common ancestor with Drosophila simulans. Comparing these data to genome sequence data from 37 different strains of Drosophila melanogaster, we detected signatures of selection in both newly gained and evolutionarily conserved binding sites. Newly evolved CTCF binding sites show a significantly stronger signature for positive selection than older sites. Comparative gene expression profiling revealed that expression divergence of genes adjacent to CTCF binding site is significantly associated with the gain and loss of CTCF binding. Further, the birth of new genes is associated with the birth of new CTCF binding sites. Our data indicate that binding of Drosophila CTCF protein has evolved under natural selection, and CTCF binding evolution has shaped both the evolution of gene expression and genome evolution during the birth of new genes.
Conflict of interest statement
The authors have declared that no competing interests exist.
Figures


Comment in
-
Natural selection molds genomic insulator elements.PLoS Biol. 2012;10(11):e1001421. doi: 10.1371/journal.pbio.1001421. Epub 2012 Nov 6. PLoS Biol. 2012. PMID: 23139641 Free PMC article. No abstract available.
-
Evolution: Positively selecting CTCF binding.Nat Rev Genet. 2013 Jan;14(1):6. doi: 10.1038/nrg3392. Epub 2012 Nov 27. Nat Rev Genet. 2013. PMID: 23183708 No abstract available.
Similar articles
-
The phylogenetic distribution of non-CTCF insulator proteins is limited to insects and reveals that BEAF-32 is Drosophila lineage specific.J Mol Evol. 2010 Jan;70(1):74-84. doi: 10.1007/s00239-009-9310-x. Epub 2009 Dec 19. J Mol Evol. 2010. PMID: 20024537
-
CTCF genomic binding sites in Drosophila and the organisation of the bithorax complex.PLoS Genet. 2007 Jul;3(7):e112. doi: 10.1371/journal.pgen.0030112. PLoS Genet. 2007. PMID: 17616980 Free PMC article.
-
Genome wide ChIP-chip analyses reveal important roles for CTCF in Drosophila genome organization.Dev Biol. 2009 Apr 15;328(2):518-28. doi: 10.1016/j.ydbio.2008.12.039. Epub 2009 Jan 8. Dev Biol. 2009. PMID: 19210964 Free PMC article.
-
CCCTC-binding factor: to loop or to bridge.Cell Mol Life Sci. 2009 May;66(10):1647-60. doi: 10.1007/s00018-009-8647-z. Cell Mol Life Sci. 2009. PMID: 19137260 Free PMC article. Review.
-
Chromatin Architecture in the Fly: Living without CTCF/Cohesin Loop Extrusion?: Alternating Chromatin States Provide a Basis for Domain Architecture in Drosophila.Bioessays. 2019 Sep;41(9):e1900048. doi: 10.1002/bies.201900048. Epub 2019 Jul 1. Bioessays. 2019. PMID: 31264253 Review.
Cited by
-
Evolution of Transcript Abundance is Influenced by Indels in Protein Low Complexity Regions.J Mol Evol. 2024 Apr;92(2):153-168. doi: 10.1007/s00239-024-10158-z. Epub 2024 Mar 14. J Mol Evol. 2024. PMID: 38485789
-
Two new insulator proteins, Pita and ZIPIC, target CP190 to chromatin.Genome Res. 2015 Jan;25(1):89-99. doi: 10.1101/gr.174169.114. Epub 2014 Oct 23. Genome Res. 2015. PMID: 25342723 Free PMC article.
-
Co-binding by YY1 identifies the transcriptionally active, highly conserved set of CTCF-bound regions in primate genomes.Genome Biol. 2013 Dec 31;14(12):R148. doi: 10.1186/gb-2013-14-12-r148. Genome Biol. 2013. PMID: 24380390 Free PMC article.
-
What Signatures Dominantly Associate with Gene Age?Genome Biol Evol. 2016 Oct 13;8(10):3083-3089. doi: 10.1093/gbe/evw216. Genome Biol Evol. 2016. PMID: 27609935 Free PMC article.
-
Evolution of H3K27me3-marked chromatin is linked to gene expression evolution and to patterns of gene duplication and diversification.Genome Res. 2014 Jul;24(7):1115-24. doi: 10.1101/gr.162008.113. Genome Res. 2014. PMID: 24985914 Free PMC article.
References
-
- Carroll SB (2008) Evo-devo and an expanding evolutionary synthesis: a genetic theory of morphological evolution. Cell 134: 25–36. - PubMed
-
- King MC, Wilson AC (1975) Evolution at two levels in humans and chimpanzees. Science 188: 107–116. - PubMed
-
- Wray GA (2007) The evolutionary significance of cis-regulatory mutations. Nat Rev Genet 8: 206–216. - PubMed
-
- Borneman AR, Gianoulis TA, Zhang ZD, Yu H, Rozowsky J, et al. (2007) Divergence of transcription factor binding sites across related yeast species. Science 317: 815–819. - PubMed
-
- Bradley RK, Li XY, Trapnell C, Davidson S, Pachter L, et al. (2010) Binding site turnover produces pervasive quantitative changes in transcription factor binding between closely related Drosophila species. PLoS Biol 8: e1000343 doi:10.1371/journal.pbio.1000343. - DOI - PMC - PubMed
Publication types
MeSH terms
Substances
Grants and funding
LinkOut - more resources
Full Text Sources
Molecular Biology Databases

