

Approaches to brain stress testing: BOLD magnetic resonance imaging with computer-controlled delivery of carbon dioxide
- PMID: 23139743
- PMCID: PMC3489910
- DOI: 10.1371/journal.pone.0047443
Approaches to brain stress testing: BOLD magnetic resonance imaging with computer-controlled delivery of carbon dioxide
Abstract
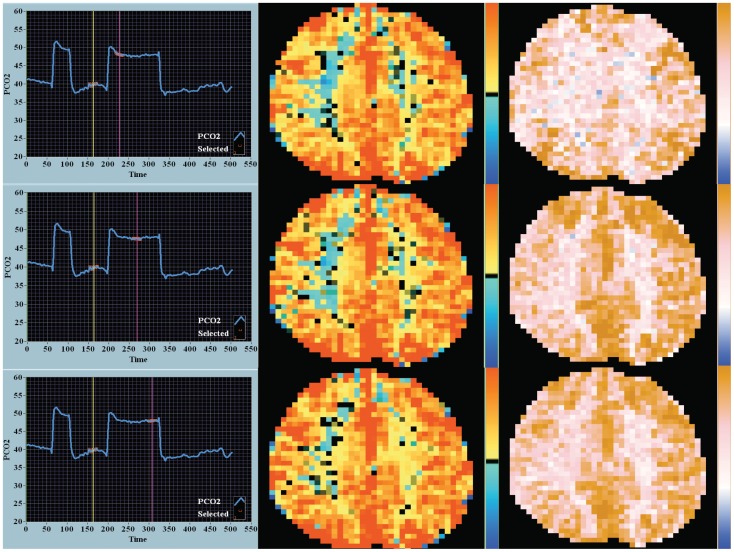
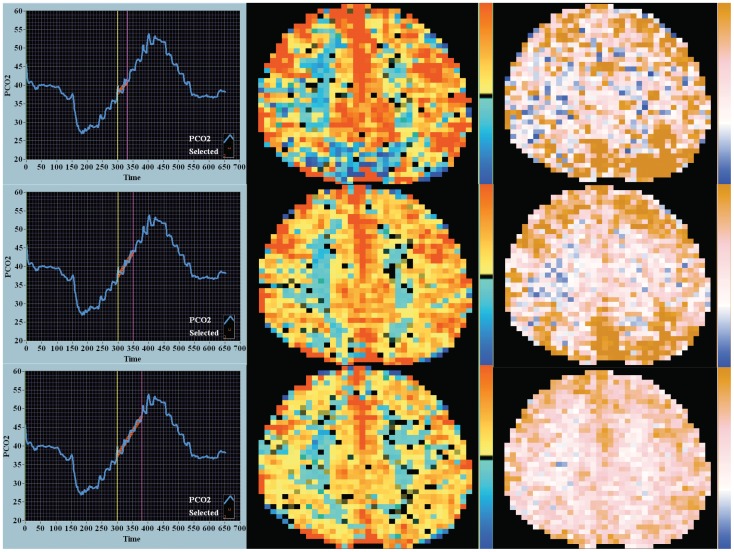
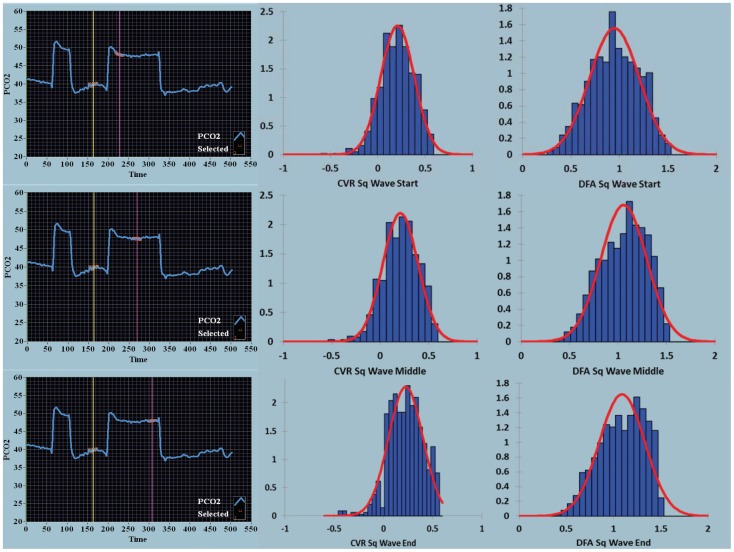
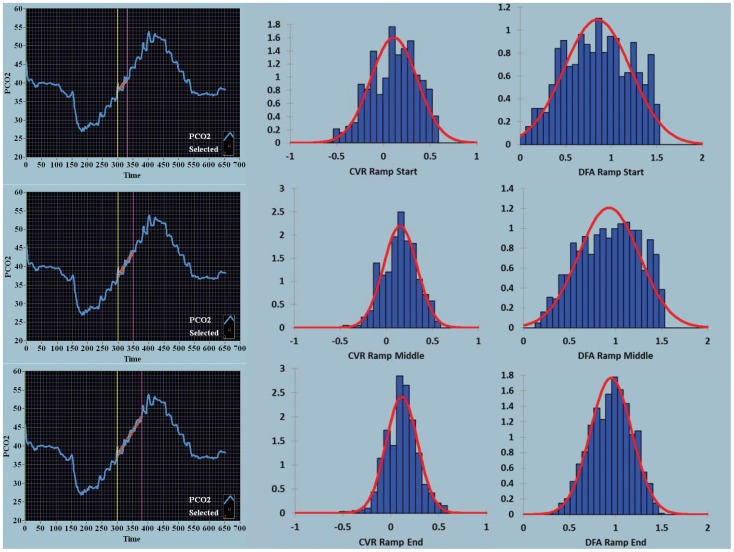
Background: An impaired vascular response in the brain regionally may indicate reduced vascular reserve and vulnerability to ischemic injury. Changing the carbon dioxide (CO(2)) tension in arterial blood is commonly used as a cerebral vasoactive stimulus to assess the cerebral vascular response, changing cerebral blood flow (CBF) by up to 5-11 percent/mmHg in normal adults. Here we describe two approaches to generating the CO(2) challenge using a computer-controlled gas blender to administer: i) a square wave change in CO(2) and, ii) a ramp stimulus, consisting of a continuously graded change in CO(2) over a range. Responses were assessed regionally by blood oxygen level dependent (BOLD) magnetic resonance imaging (MRI).
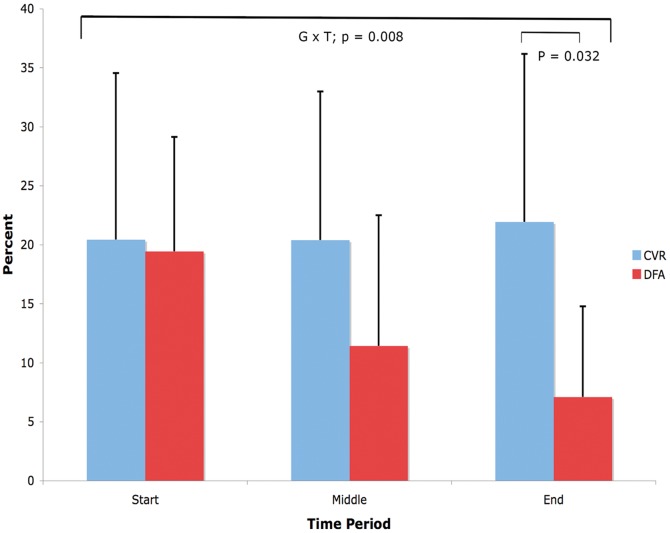
Methodology/principal findings: We studied 8 patients with known cerebrovascular disease (carotid stenosis or occlusion) and 2 healthy subjects. The square wave stimulus was used to study the dynamics of the vascular response, while the ramp stimulus assessed the steady-state response to CO(2). Cerebrovascular reactivity (CVR) maps were registered by color coding and overlaid on the anatomical scans generated with 3 Tesla MRI to assess the corresponding BOLD signal change/mmHg change in CO(2), voxel-by-voxel. Using a fractal temporal approach, detrended fluctuation analysis (DFA) maps of the processed raw BOLD signal per voxel over the same CO(2) range were generated. Regions of BOLD signal decrease with increased CO(2) (coded blue) were seen in all of these high-risk patients, indicating regions of impaired CVR. All patients also demonstrated regions of altered signal structure on DFA maps (Hurst exponents less than 0.5; coded blue) indicative of anti-persistent noise. While 'blue' CVR maps remained essentially stable over the time of analysis, 'blue' DFA maps improved.
Conclusions/significance: This combined dual stimulus and dual analysis approach may be complementary in identifying vulnerable brain regions and thus constitute a regional as well as global brain stress test.
Conflict of interest statement
Figures
Similar articles
-
A conceptual model for CO₂-induced redistribution of cerebral blood flow with experimental confirmation using BOLD MRI.Neuroimage. 2014 May 15;92:56-68. doi: 10.1016/j.neuroimage.2014.01.051. Epub 2014 Feb 5. Neuroimage. 2014. PMID: 24508647
-
Measurement of Cerebrovascular Reactivity as Blood Oxygen Level-Dependent Magnetic Resonance Imaging Signal Response to a Hypercapnic Stimulus in Mechanically Ventilated Patients.J Stroke Cerebrovasc Dis. 2018 Feb;27(2):301-308. doi: 10.1016/j.jstrokecerebrovasdis.2017.08.035. Epub 2017 Sep 28. J Stroke Cerebrovasc Dis. 2018. PMID: 28967593
-
Brain magnetic resonance imaging CO2 stress testing in adolescent postconcussion syndrome.J Neurosurg. 2016 Sep;125(3):648-60. doi: 10.3171/2015.6.JNS15972. Epub 2015 Dec 18. J Neurosurg. 2016. PMID: 26684777
-
Cerebrovascular reactivity (CVR) MRI with CO2 challenge: A technical review.Neuroimage. 2019 Feb 15;187:104-115. doi: 10.1016/j.neuroimage.2018.03.047. Epub 2018 Mar 21. Neuroimage. 2019. PMID: 29574034 Free PMC article. Review.
-
Assessment of brainstem function and haemodynamics by MRI: challenges and clinical prospects.Br J Radiol. 2023 Nov;96(1151):20220940. doi: 10.1259/bjr.20220940. Epub 2023 Sep 18. Br J Radiol. 2023. PMID: 37721043 Free PMC article. Review.
Cited by
-
A validation method for near-infrared spectroscopy based tissue oximeters for cerebral and somatic tissue oxygen saturation measurements.J Clin Monit Comput. 2018 Apr;32(2):269-284. doi: 10.1007/s10877-017-0015-1. Epub 2017 Apr 3. J Clin Monit Comput. 2018. PMID: 28374103 Free PMC article.
-
Evaluation of the cerebrovascular reactivity in patients with Moyamoya Angiopathy by use of breath-hold fMRI: investigation of voxel-wise hemodynamic delay correction in comparison to [15O]water PET.Neuroradiology. 2023 Mar;65(3):539-550. doi: 10.1007/s00234-022-03088-4. Epub 2022 Nov 25. Neuroradiology. 2023. PMID: 36434312 Free PMC article.
-
Blood-pool MRI assessment of myocardial microvascular reactivity.Front Cardiovasc Med. 2023 Nov 1;10:1216587. doi: 10.3389/fcvm.2023.1216587. eCollection 2023. Front Cardiovasc Med. 2023. PMID: 38028477 Free PMC article.
-
Emerging MRI techniques for molecular and functional phenotyping of the diseased heart.Front Cardiovasc Med. 2022 Dec 5;9:1072828. doi: 10.3389/fcvm.2022.1072828. eCollection 2022. Front Cardiovasc Med. 2022. PMID: 36545017 Free PMC article. Review.
-
Regional Cerebral Perfusion and Cerebrovascular Reactivity in Elderly Controls With Subtle Cognitive Deficits.Front Aging Neurosci. 2019 Feb 19;11:19. doi: 10.3389/fnagi.2019.00019. eCollection 2019. Front Aging Neurosci. 2019. PMID: 30837863 Free PMC article.
References
-
- Battisti-Charbonney A, Fisher JA, Duffin J (2011) Cerebrovascular and cardiovascular responses to isocapnic hypoxia. Resp Physiol Neurobiol 179: 259–268 Available:http://dx.doi.org/10.1016/j.resp.2011.09.004. - DOI - PubMed
-
- Yonas H, Pindzola RR (1994) Physiological determination of cerebrovascular reserves and its use in clinical management. Cerebrovasc Brain Metab Rev 6: 325–340. - PubMed
-
- Pindzola RR, Sashin D, Nemoto EM, Kuwabara H, Wilson JW, et al. (2006) Identifying regions of compromised hemodynamics in symptomatic carotid occlusion by cerebrovascular reactivity and oxygen extraction fraction. Neurol Res 28: 149–154. - PubMed
-
- Nemoto EM, Yonas H, Kuwabara H, Pindzola R, Sashin D, et al. (2005) Differentiating hemodynamic compromise by the OEF response to acetazolamide in occlusive vascular disease. Adv Exp Med Biol 566:135–41: 135–141. - PubMed
Publication types
MeSH terms
Substances
LinkOut - more resources
Full Text Sources
Other Literature Sources
Medical
