. 2012;7(11):e47491.
doi: 10.1371/journal.pone.0047491. Epub 2012 Nov 5.

Allele-level haplotype frequencies and pairwise linkage disequilibrium for 14 KIR loci in 506 European-American individuals

Affiliations

Allele-level haplotype frequencies and pairwise linkage disequilibrium for 14 KIR loci in 506 European-American individuals

Cynthia Vierra-Green et al. PLoS One. 2012.

Abstract

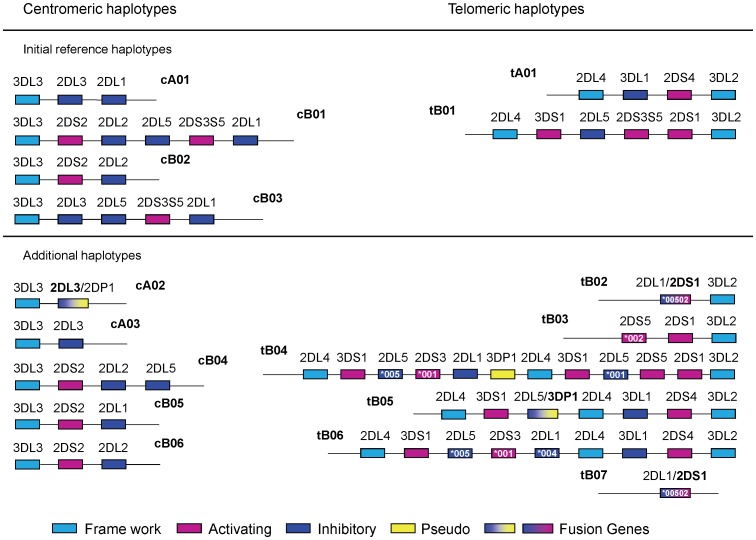
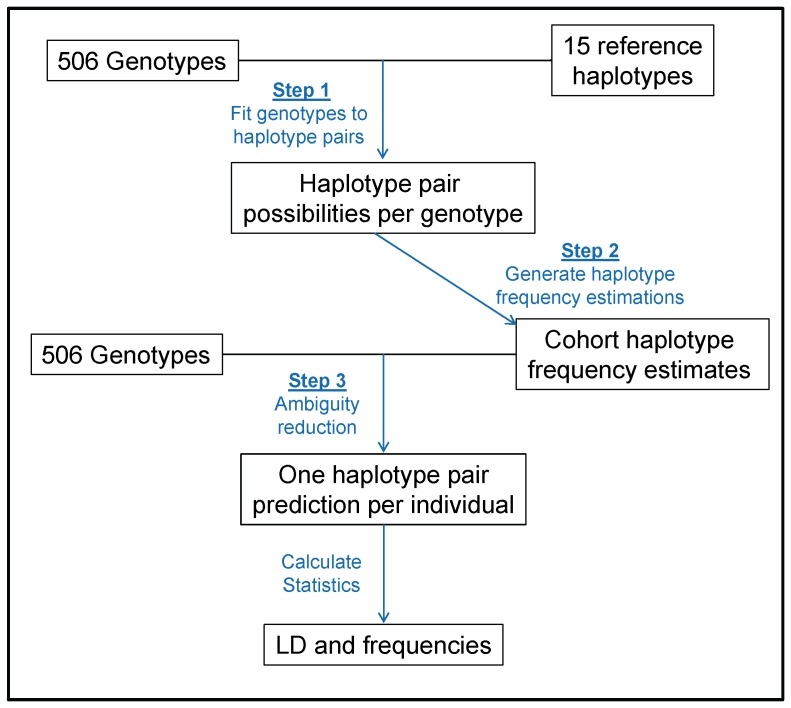
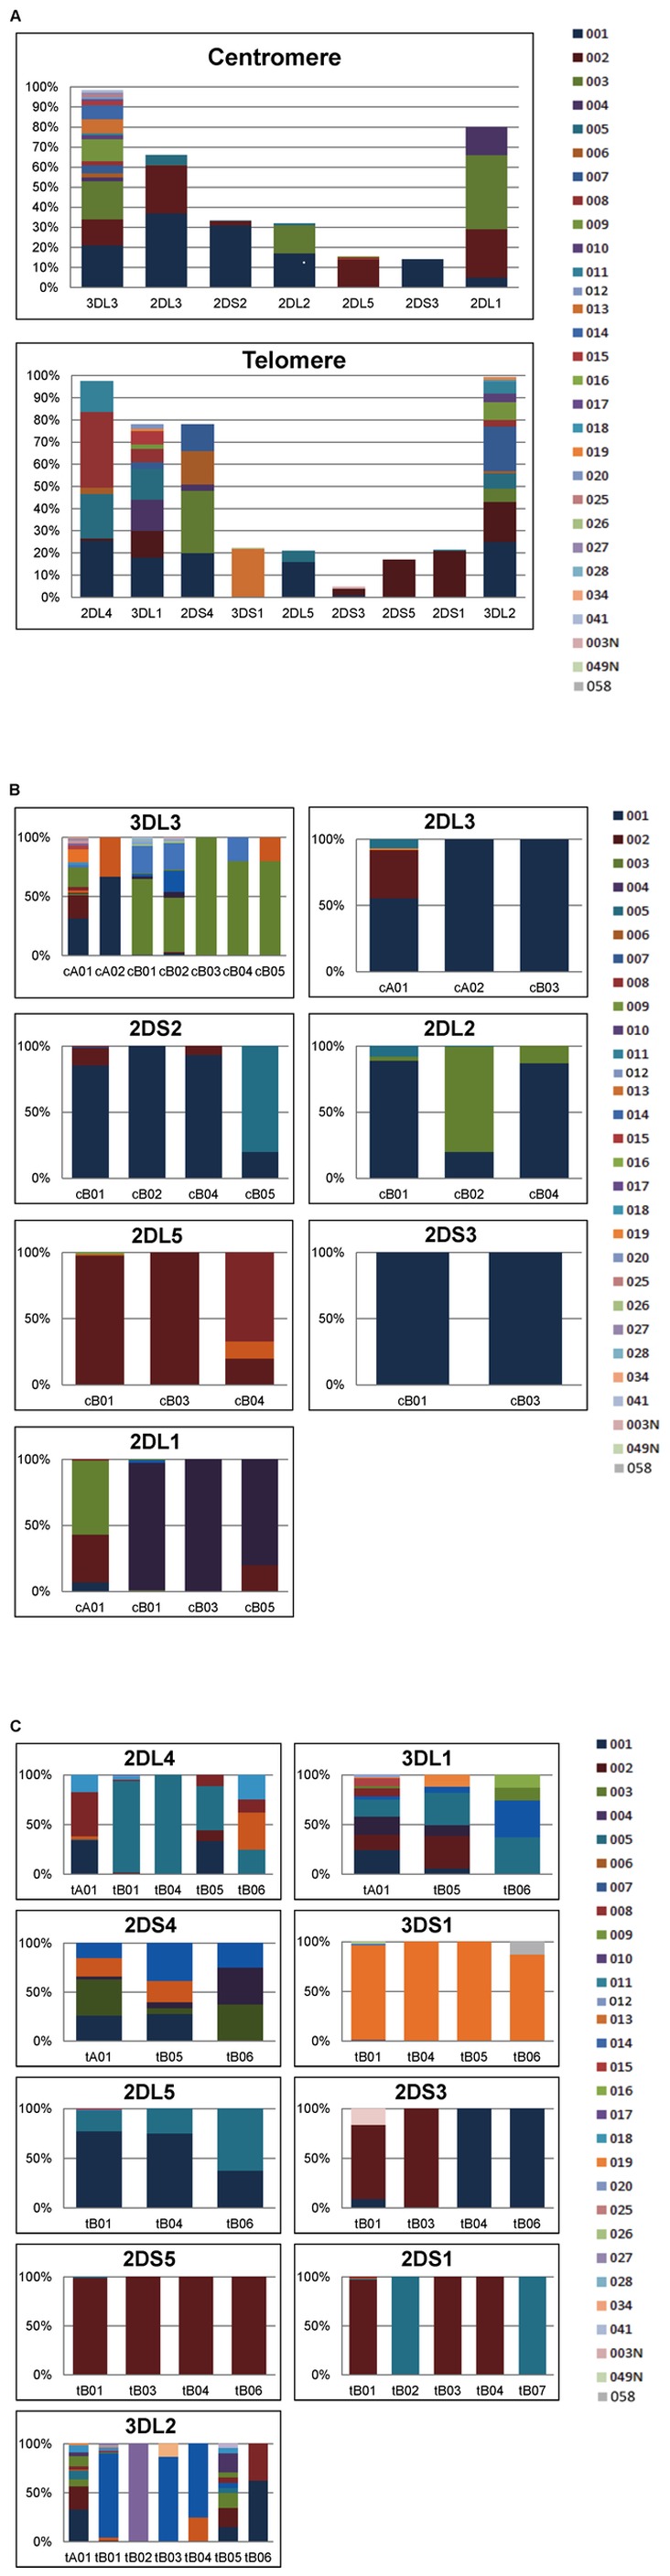
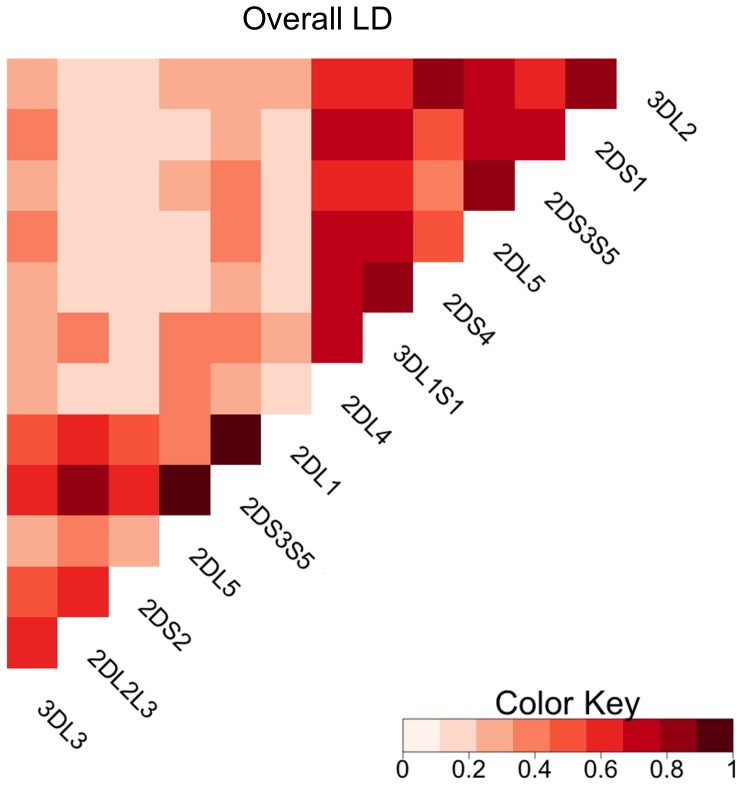
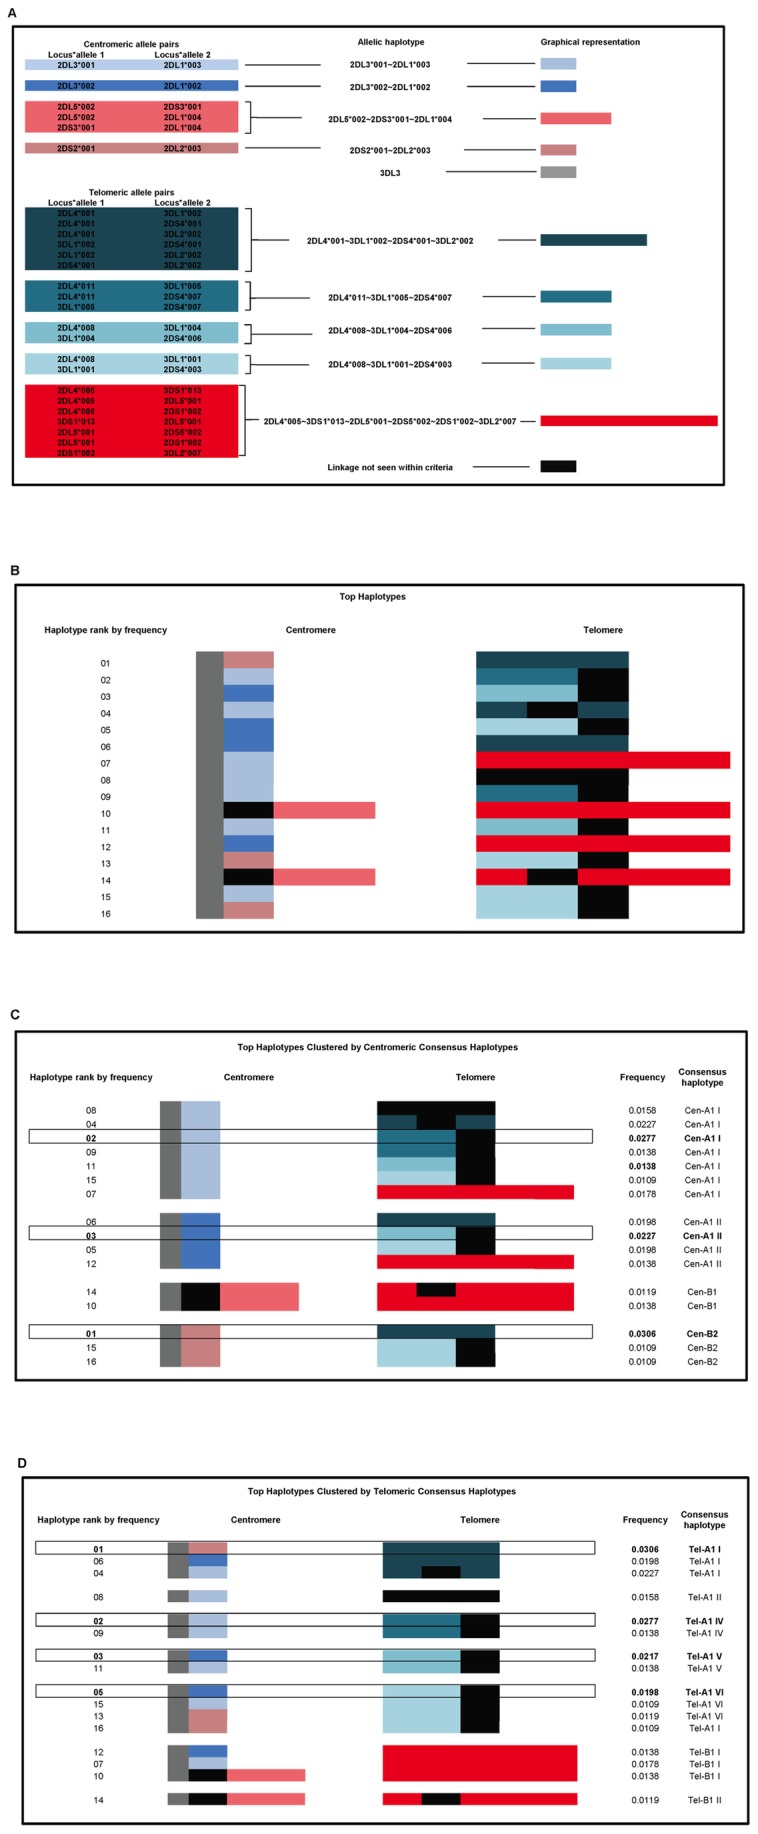
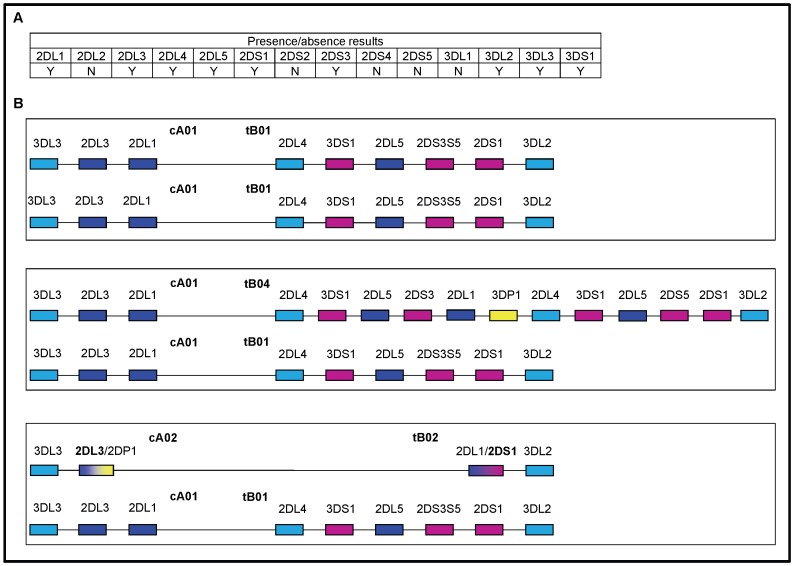
The immune responses of natural killer cells are regulated, in part, by killer cell immunoglobulin-like receptors (KIR). The 16 closely-related genes in the KIR gene system have been diversified by gene duplication and unequal crossing over, thereby generating haplotypes with variation in gene copy number. Allelic variation also contributes to diversity within the complex. In this study, we estimated allele-level haplotype frequencies and pairwise linkage disequilibrium statistics for 14 KIR loci. The typing utilized multiple methodologies by four laboratories to provide at least 2x coverage for each allele. The computational methods generated maximum-likelihood estimates of allele-level haplotypes. Our results indicate the most extensive allele diversity was observed for the KIR framework genes and for the genes localized to the telomeric region of the KIR A haplotype. Particular alleles of the stimulatory loci appear to be nearly fixed on specific, common haplotypes while many of the less frequent alleles of the inhibitory loci appeared on multiple haplotypes, some with common haplotype structures. Haplotype structures cA01 and/or tA01 predominate in this cohort, as has been observed in most populations worldwide. Linkage disequilibrium is high within the centromeric and telomeric haplotype regions but not between them and is particularly strong between centromeric gene pairs KIR2DL5∼KIR2DS3S5 and KIR2DS3S5∼KIR2DL1, and telomeric KIR3DL1∼KIR2DS4. Although 93% of the individuals have unique pairs of full-length allelic haplotypes, large genomic blocks sharing specific sets of alleles are seen in the most frequent haplotypes. These high-resolution, high-quality haplotypes extend our basic knowledge of the KIR gene system and may be used to support clinical studies beyond single gene analysis.


Conflict of interest statement

Competing Interests: The authors have declared that no competing interests exist.

Figures

Figure 1
Figure 1. Reference structures for KIR haplotype estimation.
The reference haplotypes used in the prediction model are shown as centromeric and telomeric haplotype structures (e.g., cA01 indicates centromeric A haplotype 01). The colors represent KIR gene characteristics: framework (light blue), activating (pink), inhibitory (dark blue and green), pseudogene (yellow), and fusion gene (gradient). For fusion genes, the assigned locus name is in bold. Genes represented by a single allele are labeled with the allele name. Pseudogenes are omitted except when they occur in a duplicated region or as a fusion gene. All but one haplotype (cA03∼tB07) have been previously reported , , , , , , , , .
Figure 2
Figure 2. Overview of methods for estimation of haplotypes consisting of fully resolved alleles at each locus.
Estimation was performed in three main steps. The first step uses the reference haplotype structures to generate all possible allelic haplotypes for each individual. The second step aggregates these individual haplotype possibilities across all individuals and uses an E-M algorithm to produce haplotype frequency estimates for the entire cohort. Step three utilizes these cohort-wide estimates to perform ambiguity reduction for each sample, producing a haplotype pair prediction for each individual. Further statistics are derived from these individual haplotype pair predictions.
Figure 3
Figure 3. KIR gene and allele frequencies.
The frequencies of genes in the centromeric and telomeric regions are provided for 1012 KIR haplotypes (3a). Multicolored segments represent the frequencies of alleles at each locus. Figures 3b (centromere) and 3c (telomere) depict the allele frequencies when present in the given gene-content haplotype. Duplicated loci have been excluded to conserve space.
Figure 4
Figure 4. Overall linkage disequilibrium.
Wn is displayed for each gene pair in a full-length KIR haplotype. Lighter shades indicate lower linkage disequilibrium and represent Wn approaching 0. Darker shades indicate higher linkage disequilibrium and represent Wn values approaching 1. Since they are now considered to be a single locus, KIR2DL2 and KIR2DL3 were combined into KIR2DL2L3; similarly, KIR2DS3 and KIR2DS5 were combined into KIR2DS3S5.
Figure 5
Figure 5. KIR gene haploblocks with fully resolved alleles at each locus.
Allele pairs with high significance (p< = 0.0001), LD (D’ > = 0.9), and frequency (freq > = 0.1) are shown in column 1 (5a). Pairs found on the same haplotype are combined in column 2 and are represented by larger colored blocks in column 3. Pairs that don’t meet at least one of the three criteria are represented by black boxes. Full-length KIR3DL3 genes are highly polymorphic and all alleles are represented as a single grey block. These blocks were mapped onto the 16 most frequent (freq >1%) allelic haplotypes and visually clustered by centromere (5b) and telomere (5c). The frequency within our sample and the name of the consensus haplotype (as defined by Hou et al. 2011) is shown for each haplotype. The haplotypes that are boxed and bolded emphasize that the most frequent haplotypes are generally distributed amongst different centromeric and telomeric clusters.
Figure 6
Figure 6. Structural genotypic ambiguity.
Panel a depicts the presence or absence of specific loci in a particular genotype. Panel b illustrates three of the seven haplotype pairs that are consistent with the presence/absence genotype in panel a. The haplotype pairs contain 2, 3, and 1 copies of the KIR3DS1, KIR 2DL5, and KIR2DS3S5 regions respectively.

Similar articles

Cited by

References

    1. Wilson MJ, Torkar M, Haude A, Milne S, Jones T, et al. (2000) Plasticity in the organization and sequences of human KIR/ILT gene families. Proc Natl Acad Sci U S A 97: 4778–4783. - PMC - PubMed
    1. Martin AM, Freitas EM, Witt CS, Christiansen FT (2000) The genomic organization and evolution of the natural killer immunoglobulin-like receptor (KIR) gene cluster. Immunogenetics 51: 268–280. - PubMed
    1. Martin AM, Kulski JK, Gaudieri S, Witt CS, Freitas EM, et al. (2004) Comparative genomic analysis, diversity and evolution of two KIR haplotypes A and B. Gene. 335: 121–131. - PubMed
    1. Lanier LL (2005) NK cell recognition. Annu Rev Immunol 23: 225–274. - PubMed
    1. Uhrberg M, Valiante NM, Shum BP, Shilling HG, Lienert-Weidenbach K, et al. (1997) Human diversity in killer cell inhibitory receptor genes. Immunity 7: 753–763. - PubMed

Publication types