

Secondary sympatry caused by range expansion informs on the dynamics of microendemism in a biodiversity hotspot
- PMID: 23139758
- PMCID: PMC3490955
- DOI: 10.1371/journal.pone.0048047
Secondary sympatry caused by range expansion informs on the dynamics of microendemism in a biodiversity hotspot
Abstract
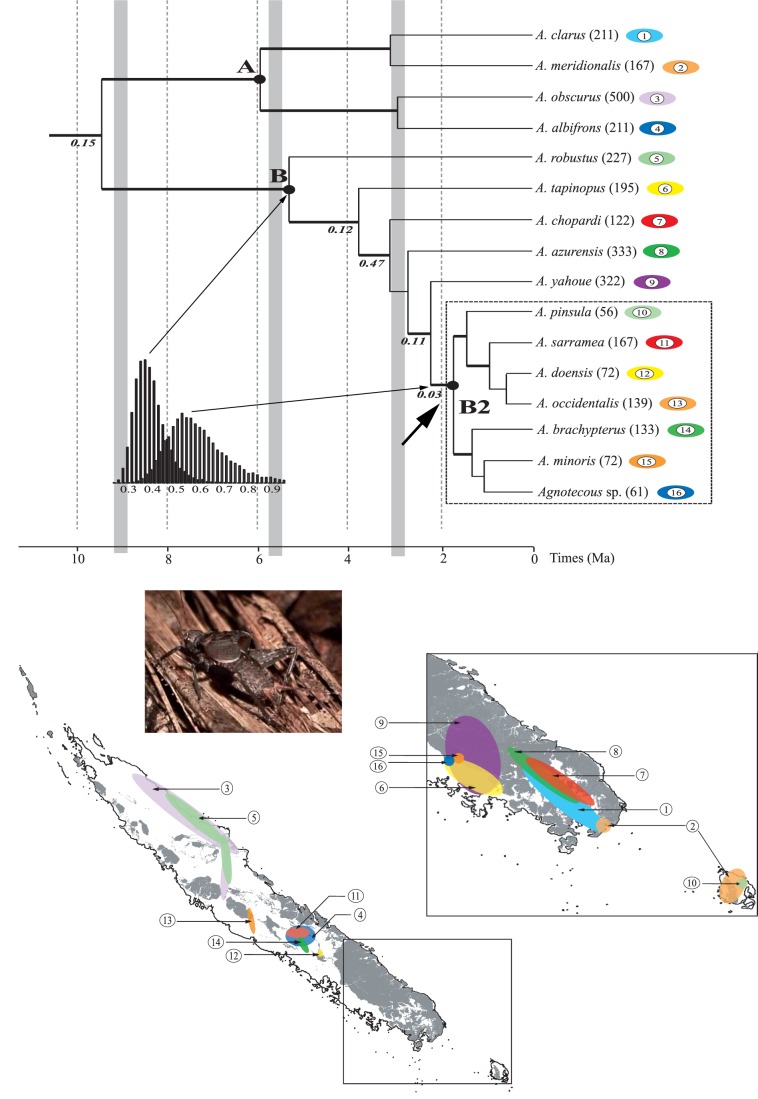
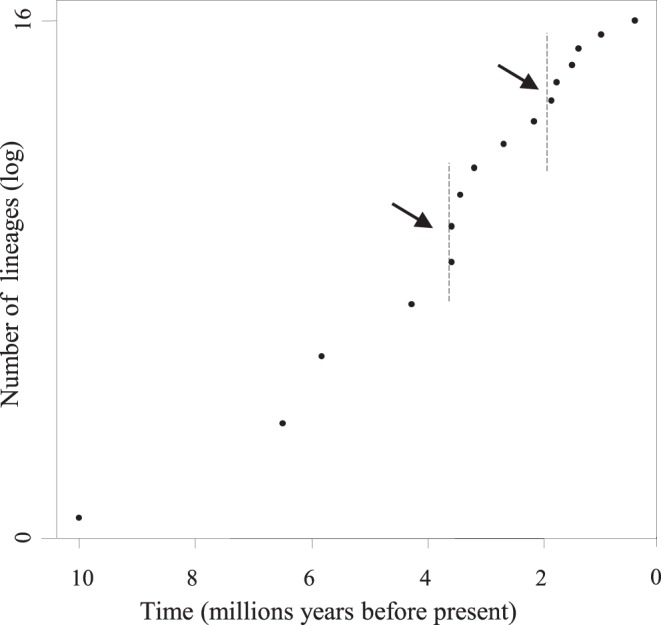
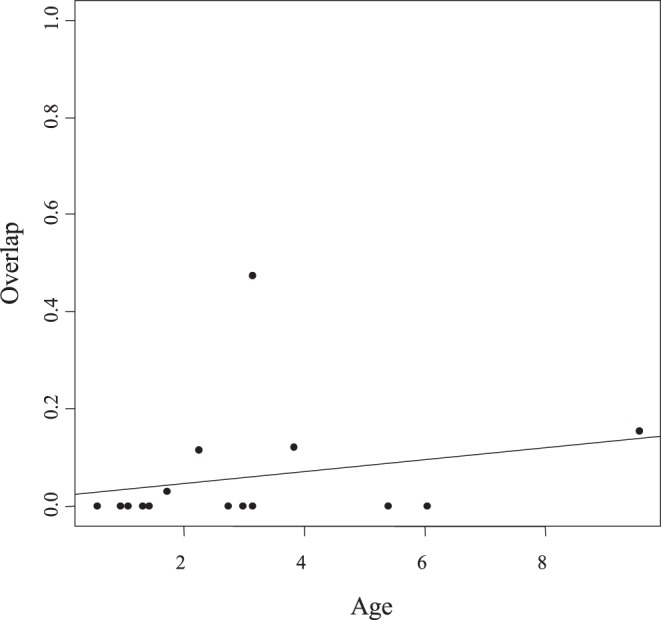
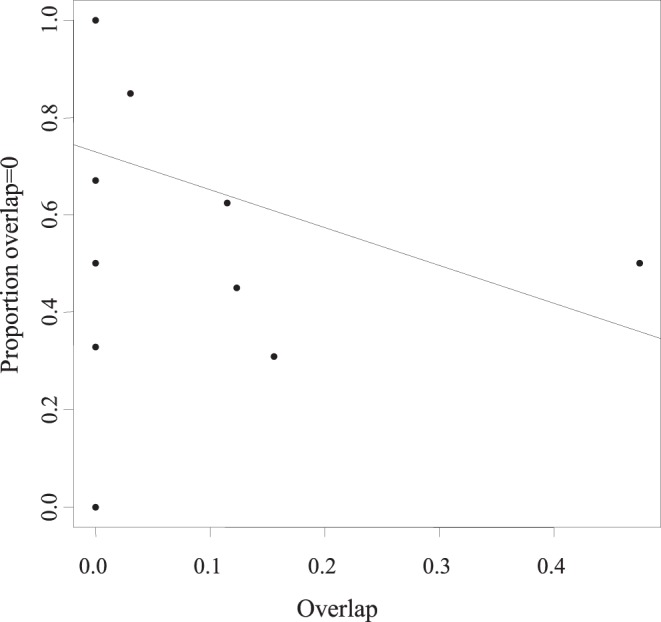
Islands are bounded areas where high endemism is explained either by allopatric speciation through the fragmentation of the limited amount of space available, or by sympatric speciation and accumulation of daughter species. Most empirical evidence point out the dominant action of allopatric speciation. We evaluate this general view by looking at a case study where sympatric speciation is suspected. We analyse the mode, tempo and geography of speciation in Agnotecous, a cricket genus endemic to New Caledonia showing a generalized pattern of sympatry between species making sympatric speciation plausible. We obtained five mitochondrial and five nuclear markers (6.8 kb) from 37 taxa corresponding to 17 of the 21 known extant species of Agnotecous, and including several localities per species, and we conducted phylogenetic and dating analyses. Our results suggest that the diversification of Agnotecous occurred mostly through allopatric speciation in the last 10 Myr. Highly microendemic species are the most recent ones (<2 Myr) and current sympatry is due to secondary range expansion after allopatric speciation. Species distribution should then be viewed as a highly dynamic process and extreme microendemism only as a temporary situation. We discuss these results considering the influence of climatic changes combined with intricate soil diversity and mountain topography. A complex interplay between these factors could have permitted repeated speciation events and range expansion.
Conflict of interest statement
Figures
References
-
- Wilson EO (1961) The Nature of the Taxon Cycle in the Melanesian Ant Fauna. American Naturalist 95: 169–193.
-
- Losos JB, Ricklefs RE (2009) Adaptation and diversification on islands. Nature 457: 830–836. - PubMed
-
- Losos JB, Schluter D (2000) Analysis of an evolutionary species-area relationship. Nature 408: 847–850. - PubMed
-
- Schliewen U, Rassmann K, Markmann M, Markert J, Kocher T, et al. (2001) Genetic and ecological divergence of a monophyletic cichlid species pair under fully sympatric conditions in Lake Ejagham, Cameroon. Molecular Ecology 10: 1471–1488. - PubMed
-
- Barluenga M, Stölting KN, Salzburger W, Muschick M, Meyer A (2006) Sympatric speciation in Nicaraguan crater lake cichlid fish. Nature 439: 719–723. - PubMed
Publication types
MeSH terms
LinkOut - more resources
Full Text Sources
Molecular Biology Databases
