. 2012;7(11):e48247.
doi: 10.1371/journal.pone.0048247. Epub 2012 Nov 6.

Homocysteine induces apoptosis of rat hippocampal neurons by inhibiting 14-3-3ε expression and activating calcineurin

Affiliations

Homocysteine induces apoptosis of rat hippocampal neurons by inhibiting 14-3-3ε expression and activating calcineurin

Jing Wang et al. PLoS One. 2012.

Abstract

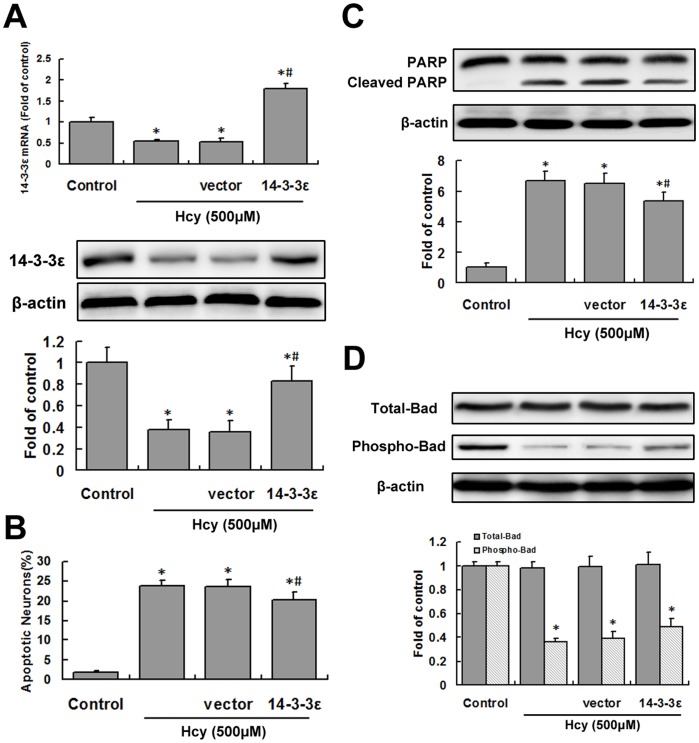
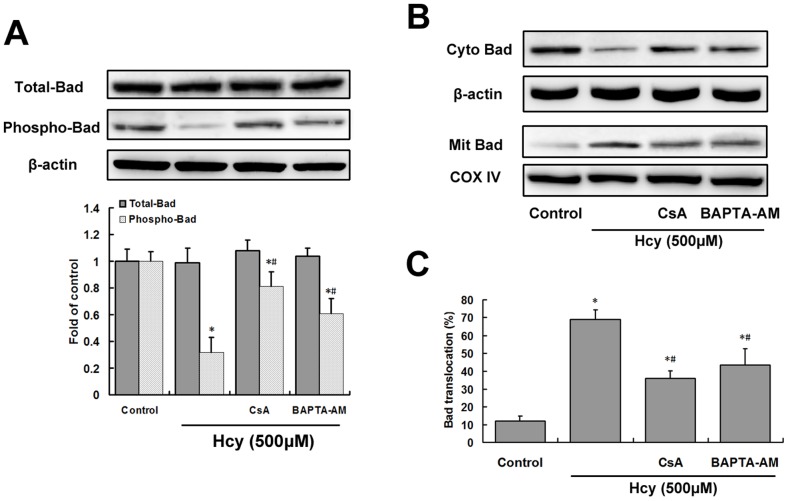
A high level of plasma homocysteine (Hcy) increases the risk for neurodegenerative diseases. One such disorder is Alzheimer's disease, which involves marked neuronal apoptosis of unknown etiology. This study shows that Hcy inhibits expression of 14-3-3ε and activates calcineurin in rat hippocampal neurons in a dose-dependent manner. Calcineurin-mediated Bad dephosphorylation, which is blocked by calcineurin inhibition and Ca(2+) chelation, causes mitochondrial translocation of Bad and apoptosis; this step in the apoptotic pathway is synergistically blocked by calcineurin inhibition and overexpression of 14-3-3ε. These findings demonstrated that calcineurin activation and downregulation of 14-3-3ε may be one of the mechanisms of Hcy-induced apoptosis of hippocampal neurons.


Conflict of interest statement

Competing Interests: The authors have declared that no competing interests exist.

Figures

Figure 1
Figure 1. Hcy induces apoptosis and suppresses 14-3-3ε expression in cultured hippocampal neurons.
A, Cultures were exposed for 24 h to either saline (Con) or 500 µM Hcy (Hcy) and were subsequently stained with the fluorescent DNA-binding dye Hoechst 33342 (top) or photographed under phase-contrast optics (bottom). Note the nuclear DNA condensation and fragmentation in neurons exposed to Hcy (arrow). Scale bar: 100 µm. B, Cultures were exposed to the indicated concentrations of Hcy for 24 h, and the percentages of neurons with apoptotic nuclei were quantified. Values are the mean ±S.E.M. of counts made in four to six cultures. C, Cells were treated as in B, and the levels of cleaved PARP were determined by western blotting. Top, representative western blots. Bottom, densitometric analysis of cleaved PARP normalized by β-actin (n = 3). D, 14-3-3ε mRNA and protein was measured by real-time quantitative PCR (top) and western blotting (mid and bottom), respectively. *P<0.05 vs. control.
Figure 2
Figure 2. The effect of lentiviral 14-3-3ε transduction on apoptosis in hippocampal neurons.
Hippocampal neurons transduced with lentiviral 14-3-3ε for 48 h were treated with Hcy for 24 h. A, 14-3-3ε mRNA and proteins were analyzed by real-time quantitative PCR or western blotting, respectively. B, The percentages of neurons with apoptotic nuclei (Hoechst staining) were quantified. C, Cleaved PARP was determined by western blotting. D, Total Bad and phospho-Bad levels were assessed by western blotting and densitometric analysis. *P<0.05 vs. control. # P<0.05 vs. Hcy treatment group.
Figure 3
Figure 3. Activation of calcineurin by Hcy and inhibition by specific blockers.
A, Cultures were exposed to the indicated concentrations of Hcy (Hcy) for 24 h, and cellular calcineurin activity was then determined. B, Cells were pretreated with 1 µM CsA or 10 µM BAPTA-AM for 30 min before exposed to 500 µM Hcy (Hcy). Cellular calcineurin activity was measured at the indicated time periods after the addition of Hcy to the cells. Values represents the mean ± S.E.M. of four or more assays. C, Cells were pretreated with 1 µM CsA or 10 µM BAPTA-AM for 30 min before exposed to 500 µM Hcy (Hcy) for 24h. Calcineurin A (Calcineurin) protein level was determined by western blotting. Top, representative western blots. Bottom, densitometric analysis. *P<0.05 vs. control. # P<0.05 vs. Hcy treatment group.
Figure 4
Figure 4. Calcineurin activation contributes to Hcy-induced dephosphorylation and mitochondrial translocation of Bad.
Cells were pretreated with 1 µM CsA or 10 µM BAPTA-AM for 30 min before treatment with 500 µM Hcy (Hcy) for 24 h. A, Total Bad and phospho-Bad levels were assessed by western blotting and densitometric analysis. B, Western blot analysis of Bad in mitochondrial (Mit) and cytoplasmic (Cyto) fractions from hippocampal neurons. C, Percentage of total Bad (cytoplasmic +mitochondrial fractions) localized to the mitochondrial fraction was determined by densitometric analysis of the data from B. Results are expressed as the mean ± S.E.M. of three experiments. *P<0.05 vs. control. # P<0.05 vs. Hcy treatment group.
Figure 5
Figure 5. Inhibition of Hcy-induced apoptosis by a calcineurin inhibitor or intracellular Ca2+ chelator.
Cells were pretreated with 1 µM CsA or 10 µM BAPTA-AM for 30 min before treatment with 500 µM Hcy (Hcy) for 24 h. A, The level of apoptosis was determined by counting the number of neurons with apoptotic nuclei. Four randomly selected fields of Hoechst-stained cells were counted and the average percentage of apoptotic cells per total number of cells was determined. B, Cleaved PARP was studied by western blotting. Results are expressed as the mean ± S.E.M. of three experiments. *P<0.05 vs. control. # P<0.05 vs. Hcy treatment group.
Figure 6
Figure 6. Calcineurin activation and 14-3-3ε suppression together contribute to Hcy-induced apoptosis.
Hippocampal neurons transduced with lentiviral 14-3-3ε for 48 h were then pretreated with 1 µM CsA for 30 min before treatment with 500 µM Hcy (Hcy) for 24 h. A, Total Bad and phospho-Bad levels were assessed by western blotting and densitometric analysis. B, Western blot analysis of Bad in mitochondrial (Mit) and cytoplasmic (Cyto) fractions from hippocampal neurons. C, Percentage of total Bad (cytoplasmic+mitochondrial fractions) localized in the mitochondrial fraction as determined by densitometric analysis of the data from B. D, The level of apoptosis was determined by counting the number of neurons with apoptotic nuclei. Four randomly selected fields of Hoechst-stained cells were counted and the average percentage of apoptotic cells per total number of cells was determined. E, Cleaved PARP was measured using western blotting. *P<0.05 vs. control. # P<0.05 vs. Hcy treatment group. Δ P<0.05 vs. CsA group.

Similar articles

Cited by

References

    1. Selhub J (1999) Homocysteine metabolism. Annu Rev Nutr 19: 217–246. - PubMed
    1. Biasioli S, Schiavon R (2000) Homocysteine as a Cardiovascular Risk Factor. Blood Purification 18: 177–182. - PubMed
    1. Joosten E, Lesaffre E, Riezler R, Ghekiere V, Dereymaeker L, et al. (1997) Is metabolic evidence for vitamin B-12 and folate deficiency more frequent in elderly patients with Alzheimer's disease? J Gerontol A Biol Sci Med Sci 52: M76–79. - PubMed
    1. Sachdev P (2004) Homocysteine, cerebrovascular disease and brain atrophy. J Neurol Sci 226: 25–29. - PubMed
    1. Eto K, Asada T, Arima K, Makifuchi T, Kimura H (2002) Brain hydrogen sulfide is severely decreased in Alzheimer's disease. Biochem Biophys Res Commun 293: 1485–1488. - PubMed

MeSH terms