. 2012 Nov 7;16(5):672-83.
doi: 10.1016/j.cmet.2012.10.004.

A quantitative map of the liver mitochondrial phosphoproteome reveals posttranslational control of ketogenesis

Affiliations

A quantitative map of the liver mitochondrial phosphoproteome reveals posttranslational control of ketogenesis

Paul A Grimsrud et al. Cell Metab. .

Abstract

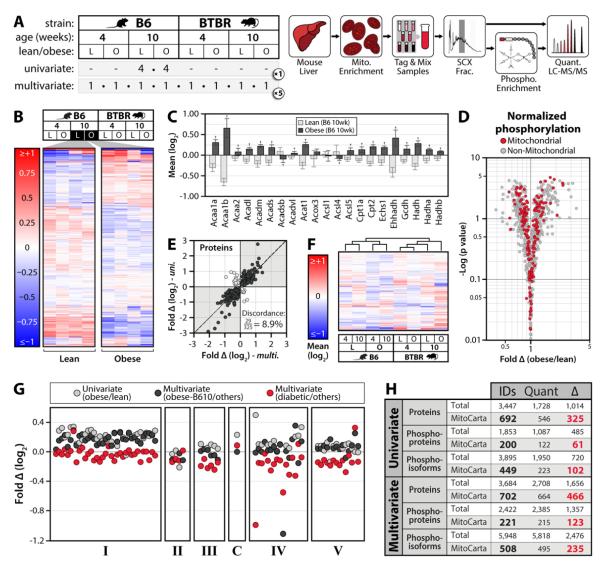
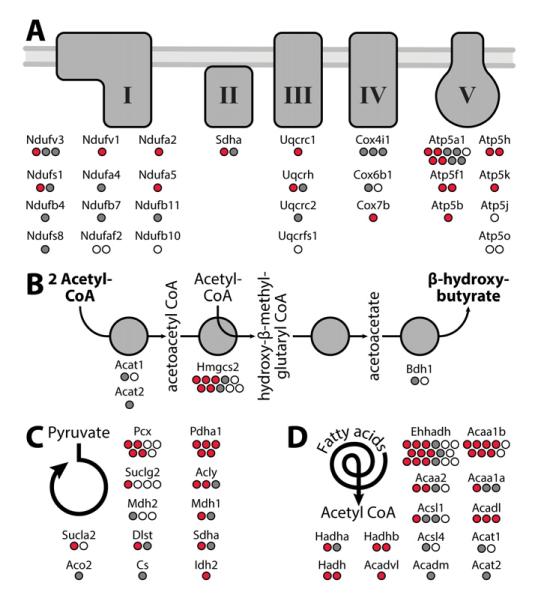
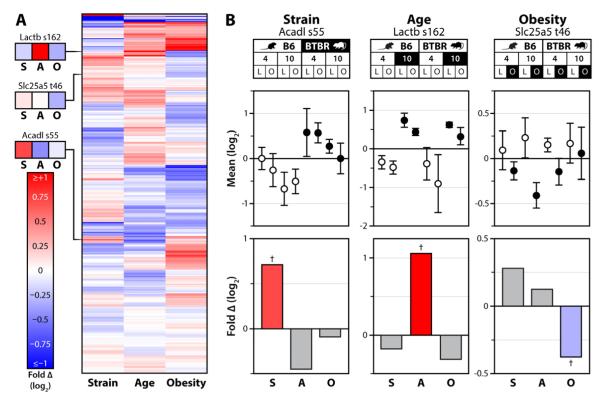
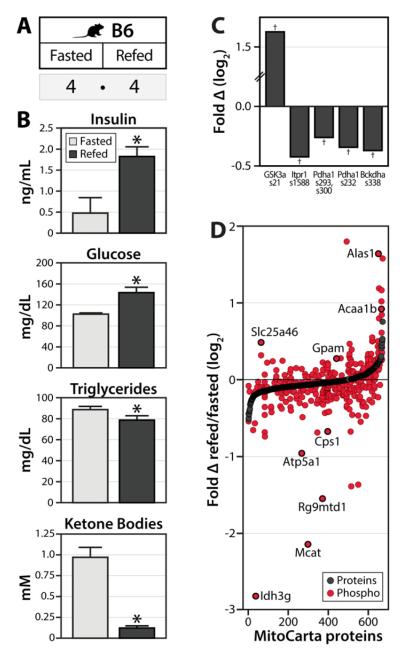
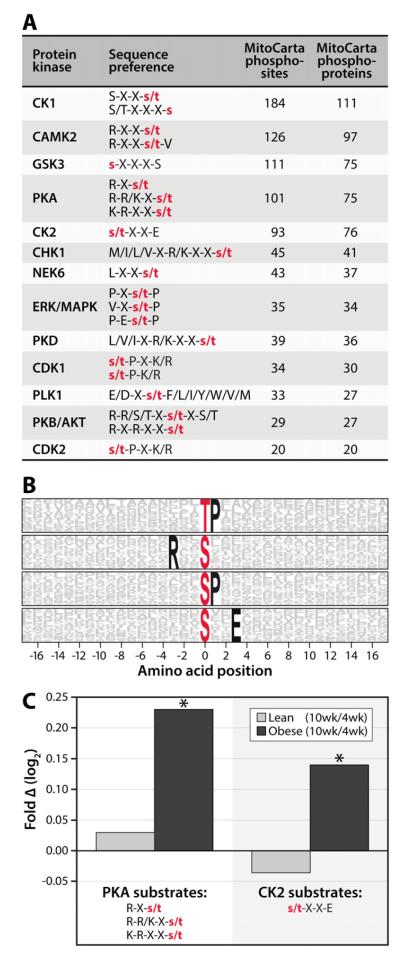
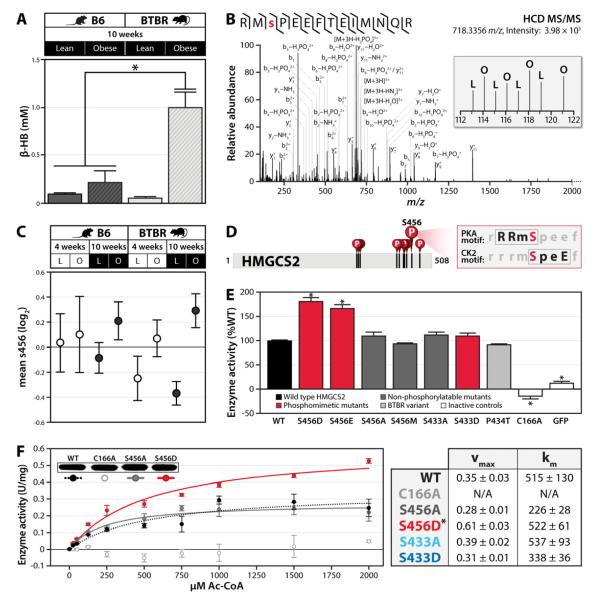
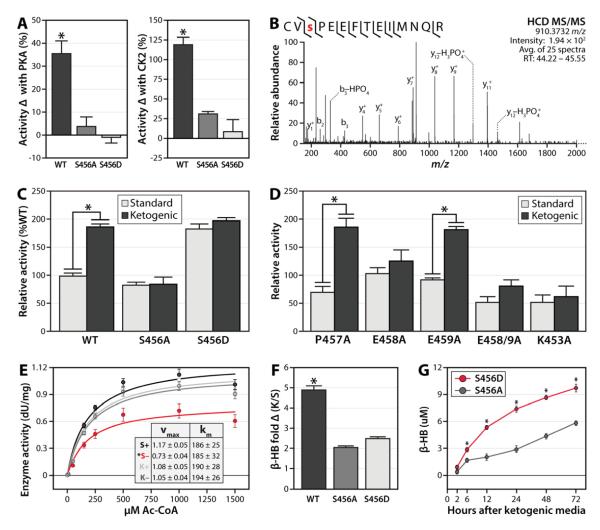
Mitochondria are dynamic organelles that play a central role in a diverse array of metabolic processes. Elucidating mitochondrial adaptations to changing metabolic demands and the pathogenic alterations that underlie metabolic disorders represent principal challenges in cell biology. Here, we performed multiplexed quantitative mass spectrometry-based proteomics to chart the remodeling of the mouse liver mitochondrial proteome and phosphoproteome during both acute and chronic physiological transformations in more than 50 mice. Our analyses reveal that reversible phosphorylation is widespread in mitochondria, and is a key mechanism for regulating ketogenesis during the onset of obesity and type 2 diabetes. Specifically, we have demonstrated that phosphorylation of a conserved serine on Hmgcs2 (S456) significantly enhances its catalytic activity in response to increased ketogenic demand. Collectively, our work describes the plasticity of this organelle at high resolution and provides a framework for investigating the roles of proteome restructuring and reversible phosphorylation in mitochondrial adaptation.


Figures

Figure 1
Figure 1. Large-scale, multiplexed proteomic and phosphoproteomic analyses of mouse liver mitochondria
A) We performed our initial analyses in two phases (left): a univariate experiment (8 mice, 2 conditions), and a multi-variable experiment (40 mice, all 8 conditions depicted). Our workflow (right) involved enriching mitochondria from liver and performing high-resolution quantitative proteomic/phosphoproteomics with 8-plex iTRAQ. B) Unsupervised hierarchical clustering of 4 lean (L) and 4 obese (O) mice (univariate). Values are mean protein abundance, relative to the average of all eight mice, on a log2 scale from <-1 to >1. C) Abundance of fatty acid oxidation proteins in lean (light grey) and obese (dark grey) mice (univariate), using the same units as panel B. Error bars indicate SD and crosses (†) indicate significant differences between lean and obese mice (q<0.1). D) Volcano plot of fold phosphorylation change (normalized to protein abundance) vs. -log (p value) for mitochondrial (red) and non-mitochondrial (grey) phosphosites (univariate). E) Abundance fold-change (obese/lean) for all proteins with significant obesity-dependent alterations (q<0.1) in B6 mice at 10 weeks in both experiments (multivariate on the x-axis and univariate on the y-axis). The percent of measurements in discordance between the two studies (light grey dots) is indicated. F) Unsupervised hierarchical clustering of each condition from the multivariate experiment based on mitochondrial proteins quantified in all five replicates. Values are mean abundance for each condition, relative to all eight conditions, on a log2 scale from <-1 to >1. G) Abundance fold changes for individual oxidative phosphorylation proteins (each represented by a circle, separated by OxPhos complexes) in the univariate experiment (obese/lean in light grey) and the multivariate experiment (obese 10-week B6 relative to all other conditions in black, obese 10-week BTBR relative to all other conditions in red). See also Table S6. H) Summary of protein and phosphorylation data. IDs, identifications at 1% FDR; Quant, measurements quantified with iTRAQ reporter ions in at least one comparison; (Δ), measurements significantly changing between any condition that was measured (q<0.1). Results are shown for both mitochondrial proteins (MitoCarta) and all proteins identified (Total), in both the univariate and multivariate experiments. See also Figure S1, Table S1-5.
Figure 2
Figure 2. Dynamic phosphorylation of key mitochondrial proteins
A-D) Identification of phosphorylation sites within key mitochondrial pathways: A) oxidative phosphorylation (OxPhos), B) ketone body production, C) the TCA cycle (and related enzymes), D) fatty acid oxidation. Phosphorylation sites exhibiting significant changes (q<0.1) are in red; sites that are not changing significantly are in grey; and sites identified, but not quantified are represented as white circles. See also Figure S2.
Figure 3
Figure 3. State-specific mitochondrial phosphorylation
A) Heat map showing unsupervised hierarchical clustering of all quantified mitochondrial phosphoisoforms across each single-variable comparison; strain (S), age (A) and obesity (O). Values are fold changes between all mice differing by the indicated variable, on a log2 scale from <-1 to >1. B) Top: 8-plex iTRAQ-based quantification of phosphorylation of Acadl serine 55, Lactb serine 162, and Slc25a5 threonine 46 is shown for each condition (with error bars representing SD from all replicates quantified) relative to the average of all eight conditions. Bottom: The same data analyzed with relative abundance reflecting the fold-change (log2 scale) between all 40 mice of the multivariate experiment separated by one variable at a time (e.g., strain analysis represents all 20 B6 mice vs. all 20 BTBR mice). The colored bars correspond to the comparisons, with the data points highlighted in black on the top panel serving as the numerator and those in white as the denominator. Crosses (†) indicate significance at q<0.1.
Figure 4
Figure 4. Acute phosphorylation changes across the mitochondrial proteome upon fasting and re-feeding
A) Eight lean B6 mice were fasted overnight (16 hrs), after which half of the animals were allowed to feed ad libitum for two hours. Liver mitochondria were isolated and subjected to the same proteomic/phosphoproteomics workflow as described in Figure 1. B) The indicated metabolites were measured from serum, with error bars indicating SEM and asterisks (*) indicating significance at p<0.05. C) Phosphorylation fold change (log2 scale) for selected regulatory site, expressed as refed/fasted with crosses (†) indicating significance at q<0.1. D) All mitochondrial proteins (MitoCarta) quantified are ranked on the x-axis by protein abundance fold change (black dots). Relative quantitation of mitochondrial phosphoisoforms (each represented by a single red dot) is plotted at the same position on the x-axis as the corresponding protein measurement. Selected phosphosites of interest are indicated. Note, the few phosphosites for which the corresponding protein was not quantified were assigned a protein fold change of “0” for graphical purposes. See also Table S7.
Figure 5
Figure 5. Protein phosphorylation measurements reveal potential kinase-substrate relationships
A) Selected kinases and their substrate consensus sequences from the PHOSIDA database are indicated, with X indicating any amino acid and red lower-case letters indicating the phosphorylated residues. The number of MS/MS-identified mitochondrial phosphorylation sites and phosphoproteins (MitoCarta) that satisfy the sequence preferences for each kinase are listed. B) Motif-X logo indicating amino acid sequence motifs overrepresented around identified phosphorylation sites on MitoCarta proteins. The red letters at position “0” indicate the phosphorylated residue and the probability of an amino acids being present within 17 residues to each side are represented by the height of the respective single-letter symbol. Residues that are “fixed” in the motif (or are always present) span the entire height of the logo and are shown in black (unfixed residues are in grey). C) Relative changes in kinase activity were predicted by averaging phosphosite quantitation for all substrates (mitochondrial and non-mitochondrial) phosphorylated on PKA (left) or CK2 (right) consensus sites. Values are expressed as fold change (10 week/4 week) on a log2 scale in both the lean (light grey bars) and obese (black bars) conditions, with asterisks (*) indicating significance at p<0.05. See also Figure S3.
Figure 6
Figure 6. Identification of serine 456 on Hmgcs2 as a candidate regulatory PTM
A) β-hydroxybutyrate (β-HB) levels were measured in serum from lean and obese B6 and BTBR mice at 10 weeks of age. Bars indicate SEM. B) Single scan MS2 spectrum and manual validation identifying phosphorylation of serine 456 (S456) on mouse Hmgcs2. The inset shows iTRAQ reporter ions providing relative quantitation of S456 phosphorylation in lean (L) and obese (O) mice from the univariate study. C) Relative phosphorylation levels on Hmgcs2 S456 in the multivariate experiment. Datapoints indicate condition-specific mean, relative to the average of all eight conditions (log2 scale), with error bars indicating the SD of all replicates quantified. Note, conditions highlighted in black are the same as those assessed in panel A. D) Schematic of Hmgcs2 primary sequence highlighting identified phosphorylated residues, including the PKA and CK2 consensus site at S456. E) Activity of FLAG-tagged wild type (WT) HMGCS2 and the indicated mutants (C166A is catalytically dead control) and GFP, using 1000 μM Ac-CoA as the substrate. Activity is expressed as a percent of WT and error bars indicate SD of triplicate analyses. F) Enzyme activity kinetic curve for FLAG-tagged wild type (WT), S456A, S456D, and C166A HMGCS2. Error bars indicate SD. Kinetic parameters for selected Hmgcs2 variants are shown at the right. Asterisks (*) indicate significance at p<0.05. See also Figure S4.
Figure 7
Figure 7. Phosphorylation of serine 456 on HMGCS2 increases enzyme activity and is induced during ketogenesis
A) Percent increase in HMGCS2 activity after performing in vitro kinase reactions with either PKA (left) or CK2 (right), error bars indicate SEM. B) Mass spectrum (average of 25 MS2 scans) identifying phosphorylation of S456 on human HMGCS2 after reaction with PKA seen in panel A. C) HMGCS2 enzyme activity at 1000 μM Ac-CoA after immuoprecipitation from HEK293 cells grown in either standard or ketogenic media for 72 hours. Values are normalized to WT in standard media, error bars indicate SEM. D) Activity of HMGCS2 kinase recognition motif mutants, using same assay as in panel C. E) Enzyme activity kinetic curve for FLAG-tagged WT HMGCS2 immuoprecitiated from HEK293 cells cultured for 72 hours in either standard (S) or ketogenic (K) media, and subsequently incubated with (+) or without (−) CK2 in an in vitro assay. Error bars indicate SD. Kinetic parameters are shown in the inset. F) Fold increase in β-hydroxybutyrate (β-HB) levels produced by HEK293 cells expressing HMGCS2 variants upon culturing in ketogenic (K) media for 72 hours, relative to standard (S) media. G) β-hydroxybutyrate (β-HB) levels in S456A (grey) or S456D (red) mutant HMGCS2-transfected HEK293 cells over a timecourse of culturing in ketogenic media. Asterisks (*) indicate significance at p<0.05. See also Figure S5.

References

    1. Acin-Perez R, Salazar E, Kamenetsky M, Buck J, Levin LR, Manfredi G. Cyclic AMP produced inside mitochondria regulates oxidative phosphorylation. Cell metabolism. 2009;9:265–276. - PMC - PubMed
    1. Berry MN, Clark DG, Grivell AR, Wallace PG. The calorigenic nature of hepatic ketogenesis: an explanation for the stimulation of respiration induced by fatty acid substrates. Eur J Biochem. 1983;131:205–214. - PubMed
    1. Boja ES, Phillips D, French SA, Harris RA, Balaban RS. Quantitative Mitochondrial Phosphoproteomics Using iTRAQ on an LTQ-Orbitrap with High Energy Collision Dissociation. J Proteome Res. 2009;8:4665–4675. - PMC - PubMed
    1. Bonet ML, Ribot J, Palou A. Lipid metabolism in mammalian tissues and its control by retinoic acid. Biochim Biophys Acta. 2012;1821:177–189. - PubMed
    1. Buchner DA, Yazbek SN, Solinas P, Burrage LC, Morgan MG, Hoppel CL, Nadeau JH. Increased mitochondrial oxidative phosphorylation in the liver is associated with obesity and insulin resistance. Obesity (Silver Spring) 2011;19:917–924. - PMC - PubMed

Publication types