. 2012 Nov 9;151(4):709-723.
doi: 10.1016/j.cell.2012.08.045.

Pathogenic SYNGAP1 mutations impair cognitive development by disrupting maturation of dendritic spine synapses

Affiliations

Pathogenic SYNGAP1 mutations impair cognitive development by disrupting maturation of dendritic spine synapses

James P Clement et al. Cell. .

Abstract

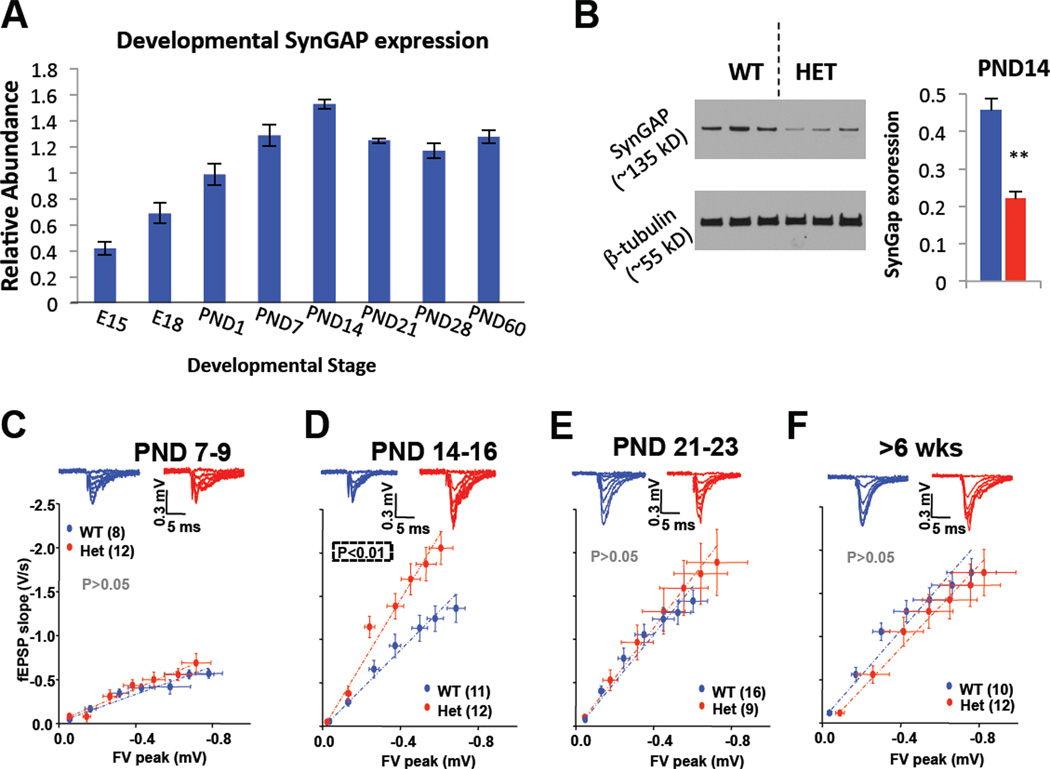
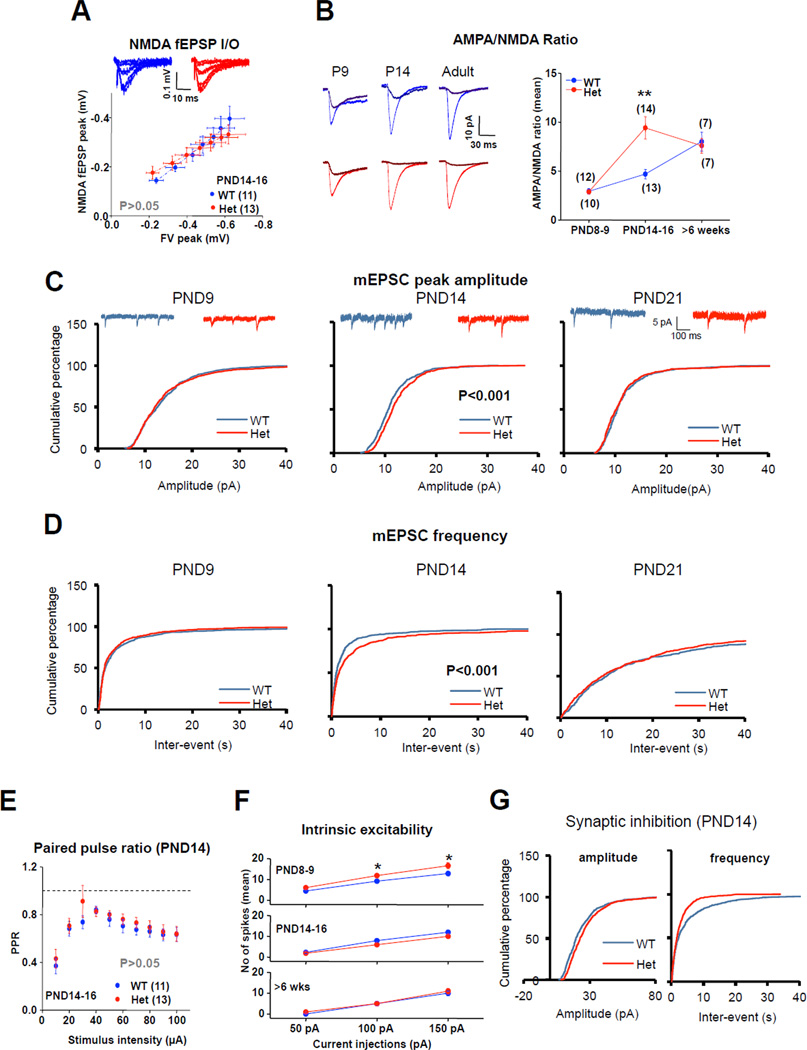
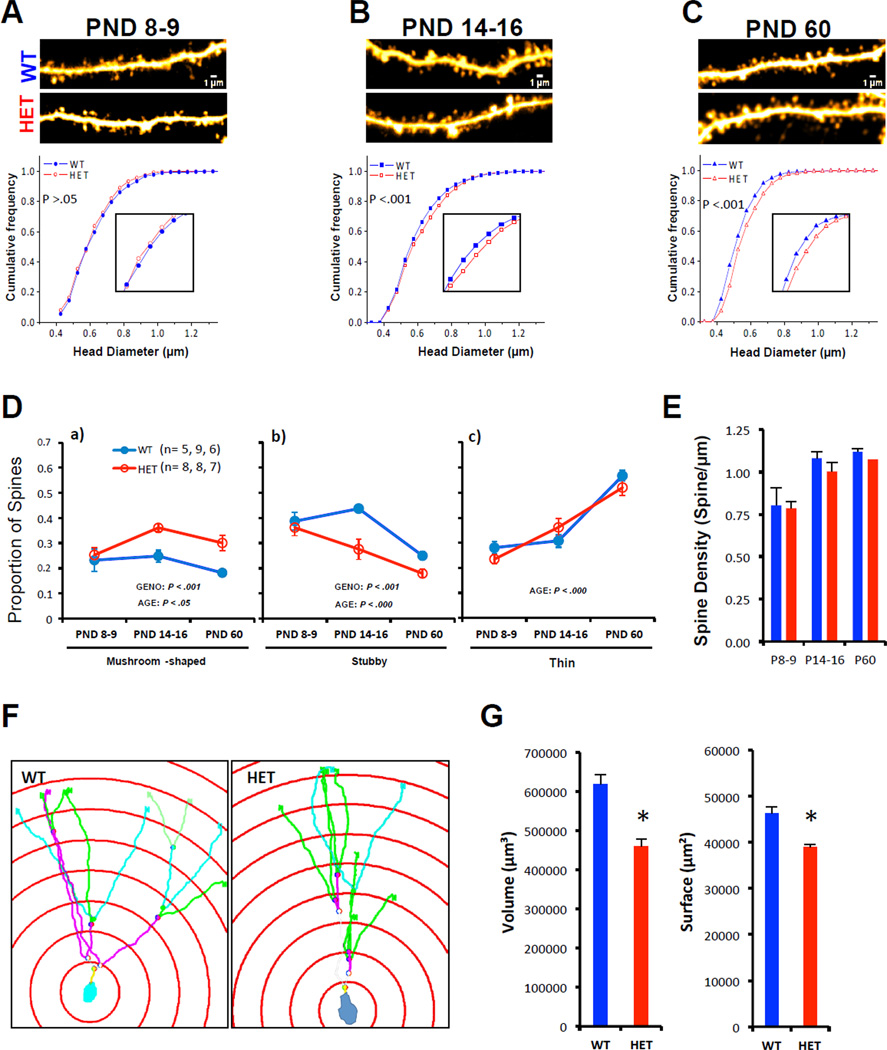
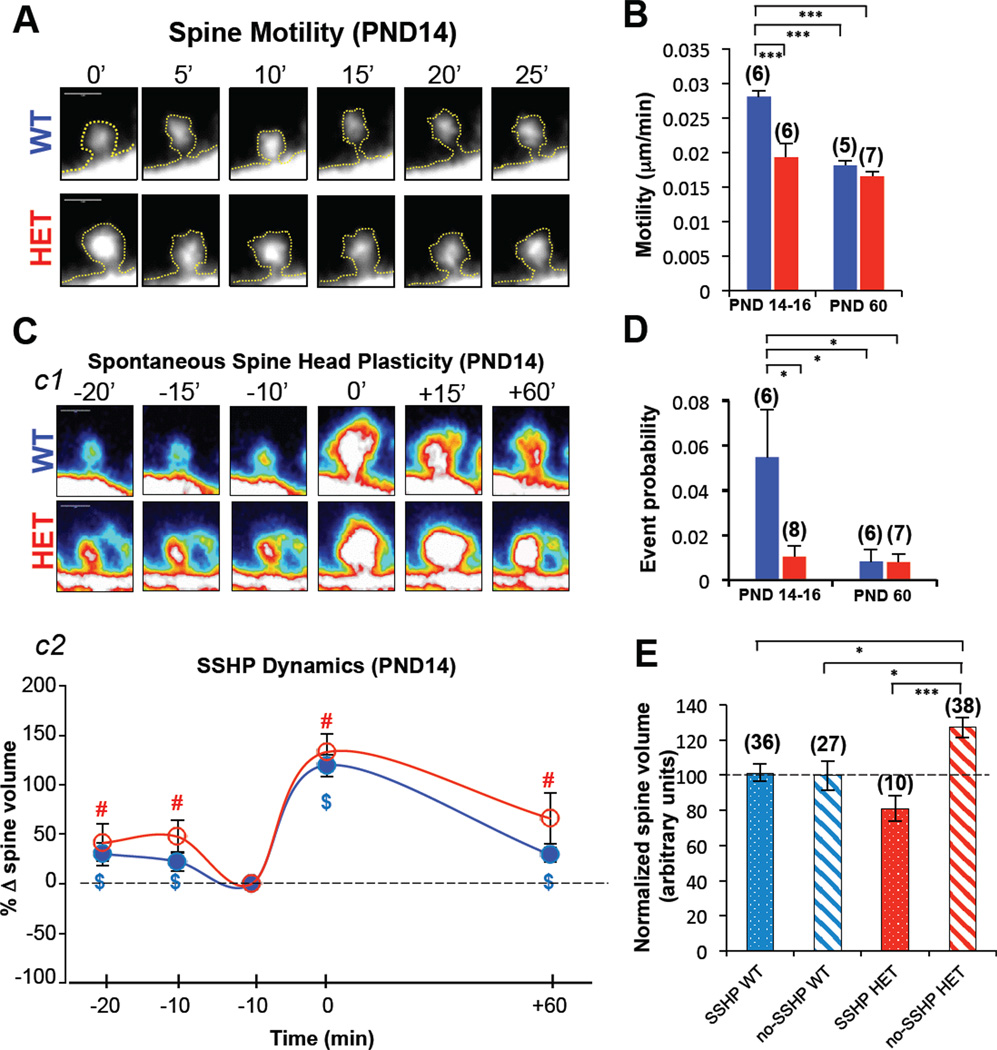
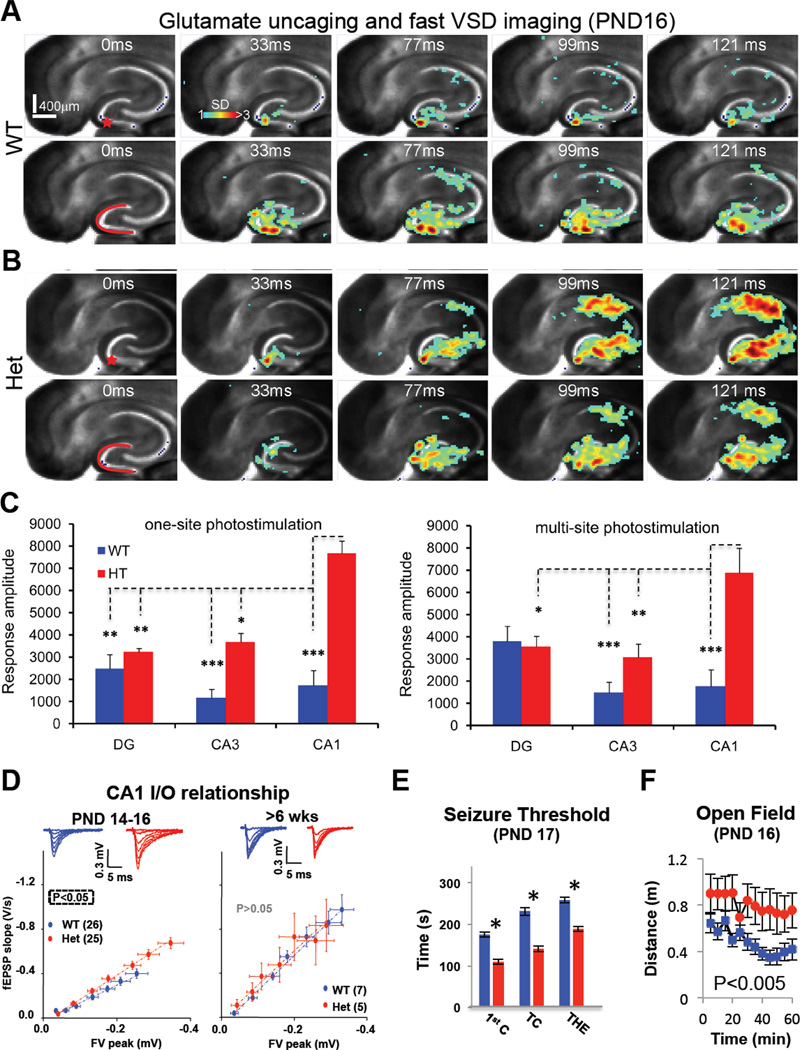
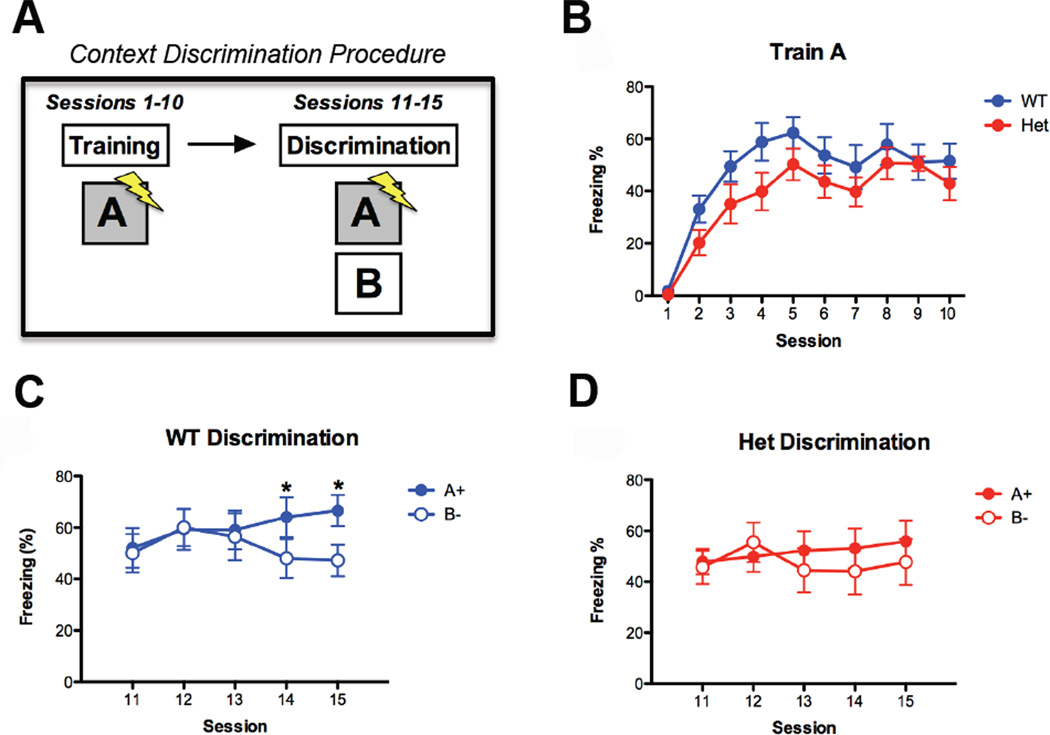
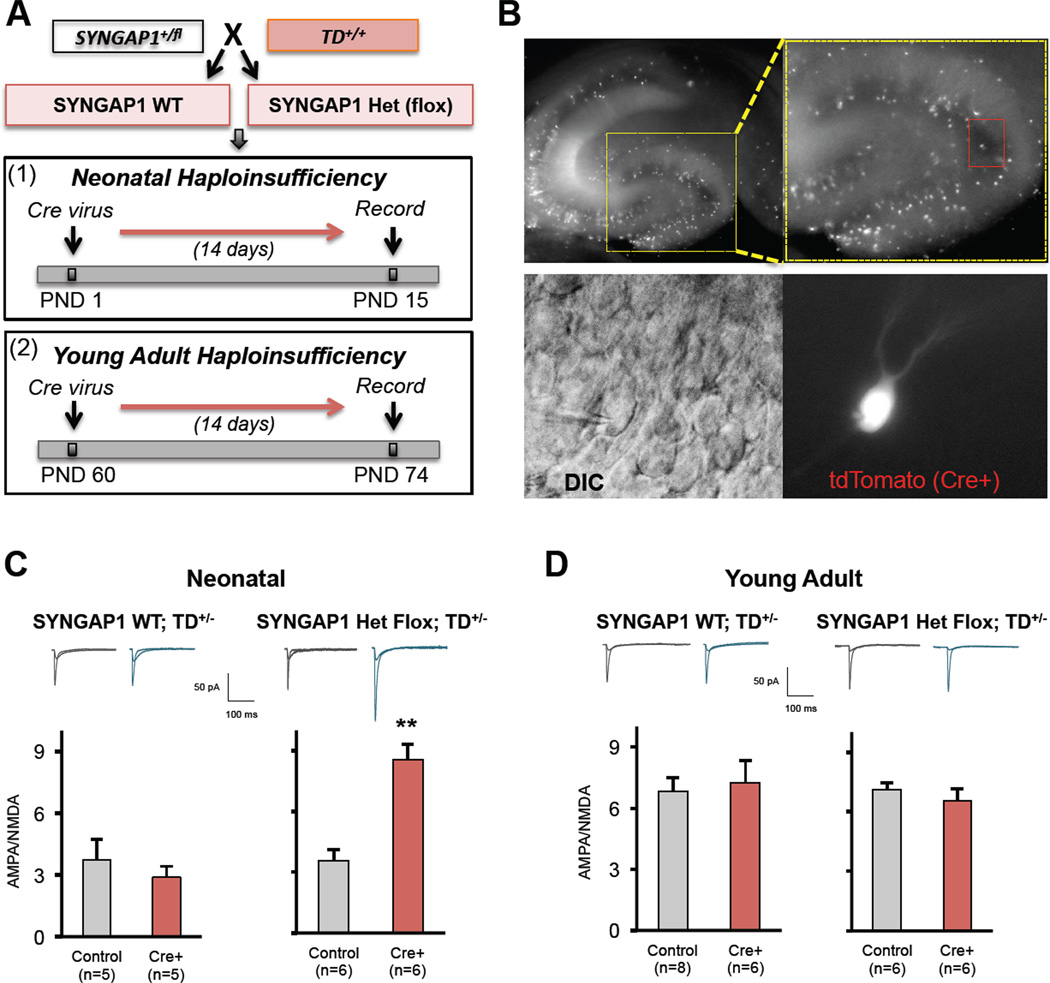
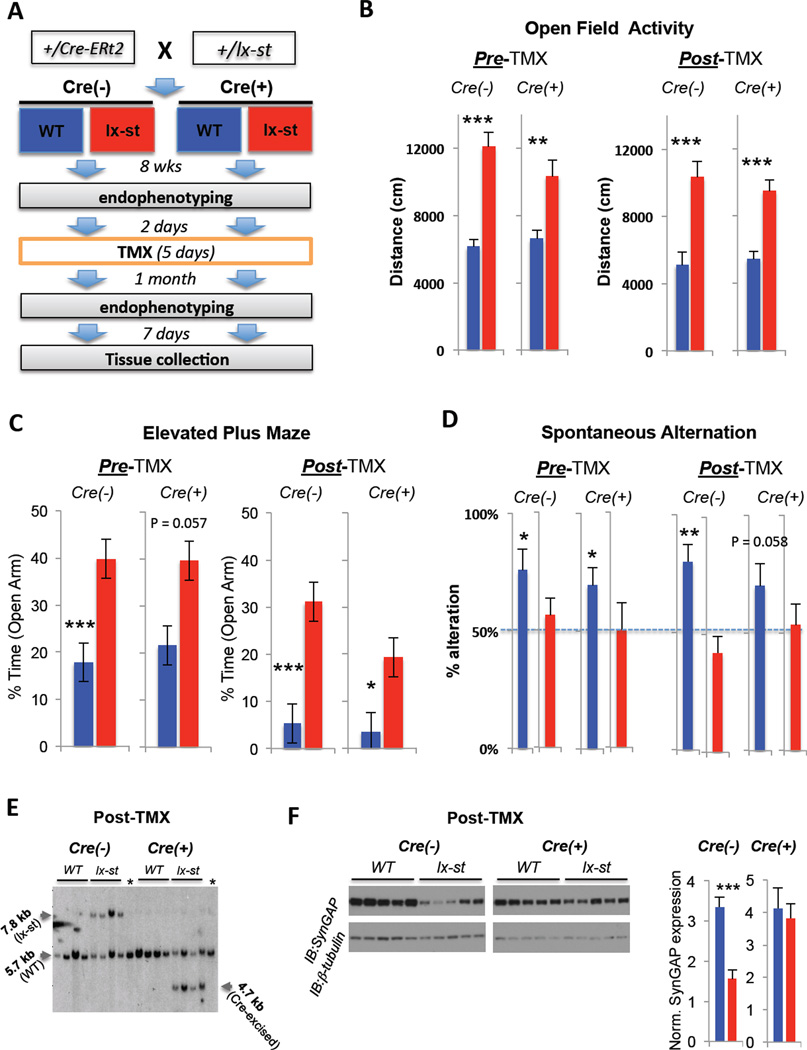
Mutations that cause intellectual disability (ID) and autism spectrum disorder (ASD) are commonly found in genes that encode for synaptic proteins. However, it remains unclear how mutations that disrupt synapse function impact intellectual ability. In the SYNGAP1 mouse model of ID/ASD, we found that dendritic spine synapses develop prematurely during the early postnatal period. Premature spine maturation dramatically enhanced excitability in the developing hippocampus, which corresponded with the emergence of behavioral abnormalities. Inducing SYNGAP1 mutations after critical developmental windows closed had minimal impact on spine synapse function, whereas repairing these pathogenic mutations in adulthood did not improve behavior and cognition. These data demonstrate that SynGAP protein acts as a critical developmental repressor of neural excitability that promotes the development of life-long cognitive abilities. We propose that the pace of dendritic spine synapse maturation in early life is a critical determinant of normal intellectual development.


Figures

Figure 1
Figure 1. A restricted period of elevated excitatory synaptic transmission in developing SynGAP mutants
A) SYNGAP1 transcript levels were measured in WT C57/Bl6J mice by qPCR throughout development. Relative abundance was calculated by normalizing SynGAP transcript levels to GAPDH levels, which was previously determined to not change during development. B) Hippocampi from WT (n=3) and Het (n=3) PND14 mice were extracted and probed for SynGAP and β-tubulin expression; (ANOVA, F(1,5)=28.2, p=.006). C-F) Representative traces of field EPSPs and summary graphs of input-output relationships from the MPP input into the DGNs measured during different developmental epochs. Significance was determined using an ANOVA to compare slopes after linear regression. n = slices. Error bars represent SEM.
Figure 2
Figure 2. Developmental disruptions to Het synaptic transmission are caused by enhanced sensitivity of AMPA receptors to released glutamate
A) Isolated NMDAR-mediated fEPSPs at PND14-16. n = slices. B) Representative traces (left) and summary data of AMPA/NMDA ratios evoked from mild stimulation of MPP in patch-clamped DGGCs (ANOVA; PND7-9: F1,20= 0.031, p>0.05; PND14-16: F1,25=13.76, P<0.01; Adult: F1,12=0.118, P>0.05). C) Cumulative percentage of mEPSC amplitude from PND9 (n=800), PND14 (n=1300), PND21 (n=500). Note an increase in mEPSC amplitude only at PND14 (P<0.05; 2-sample K-S test). D) Summary of cumulative percentage of mEPSC inter-event interval, which is reduced at PND14 (P<0.05; 2-sample K-S test). E) Paired-Pulse ratio in WT and SynGAP Hets at PND 14-16 (RMANOVA; F1,23=0.898; P>0.05). F) Intrinsic excitability of DGGNs observed by variable current injections into patch-clamped cells at PND14-16 [RMANOVA (PND8-9; F1,24= 5.139, P<0.05; PND14-16: F1,40=2.280, P>0.05; >6weeks: F1,11= 0.353, P>0.05; asterisks denote significance after Bonferroni Post Hoc test, P<0.05). n=neurons. G) Cumulative probability of mIPSC amplitude (P<0.05, 2-sample K-S test) and frequency (P<0.05, 2-sample K-S test), respectively, from PND14; n=700. Error bars represent SEM.
Figure 3
Figure 3. Emergence of abnormal spine size and shape in SYNGAP1 mutants during the second postnatal week
A-C) Representative multiphoton excitation images of dendrites (scale bar = 1 µm) obtained in live acute brain slices in both WT and SYNGAP1 Hets. Cumulative frequency curves of spine head diameter in both groups across three stages of development [PND8-9, WT (n=687 spines) vs. Het (n=687); PND14-16, WT (n=1650) vs. Het (n=1650); PND60, WT (n= 963) vs. Het (n=963); K-S test was performed because a population defined by spine head diameter results in a clear non-normal distribution. Inset shows spine diameters from 0.6–0.9 um. D) Graphs depicting the proportion of Mushroom (left), Stubby (middle) and Thin (right) spines in WT and Het mice at three different developmental stages; Mushroom: Genotype [F(1, 37)=15.243, p=.00039]; Age [F(2, 37)=4.1677, p=.02332], Stubby: Genotype [F(1, 37)=13.167, p=.00086]; Age [F(2, 37)=17.451, p=.00000], Thin: Age [F(2, 37)=52.569, p=.00000]. n= slices. E) Density of WT (blue) and Het (red) spines at three different developmental time points were calculated (ANOVA; Genotype [F(1, 38)=.98887, p=.32631]; Age [F(2, 38)=14.048, p=.00003]; Genotype × Age [F(2, 38)=.13787, p=.87164]. F) Representative examples of 3D-reconstruction and Sholl ring analysis in dentate gyrus granular neuons (PND 16). G) Histograms showing volumetric and surface extension field of dentate gyrus neurons in both WT (n=40 traced neurons from 4 animals) and Het (n=40 traced neurons from 4 animals) mice; Student t test, *p<.05. Values represent means ± SEM.
Figure 4
Figure 4. SYNGAP1 haploinsufficiency disrupts developmental spine dynamics
A) Multiphoton excitation images of an individual spine over time taken from acute slices in WT and Het mice at PND14. B) Motility of Het (red) and WT (blue) spines from slices taken at PND14-16 and PND60 [ANOVA two-way; Genotype (F(1,20)=19.439, P=.00027); Age (F(1,20)=29.338, P=.00003); Interaction (F(1,20)=9.3201, P=.00628)]; n = slices. C) c1, frames of individual spines in acute slices showing spontaneous spine head plasticity (SSHP) at PND14-16. c2, Spontaneous spine head plasticity kinetic curves of WT (n=36) and Het (n=10) spine populations demonstrating this phenomenon at PND14-16 [One-sample T-test (population mean = 100), $ = WT significance, # = Het significance, P < .05). D) Graph depicting SSHP event probability (probability that any observed spine in the brain slice would change volume >50% between 2 successive frames) in WT (blue) and Het (red) slices at PDN14-16 and PND60; [ANOVA two-way (Genotype [F(1,23)=4.6586, P=.04157]; Age [F(1,23)=5.6275, P=.02643]; Interaction [F(1,23)=4.6034, P=.04270]]; n = slices. E) Spine Head Volume measurements were made in spines that underwent plasticity (10 minutes before observation of >50% spine volume change) and spines that did not display this behavior (no-SSHP; spine chosen at random and volume measurement chosen at a randomly selected time point); thus dividing spines into two populations- plastic and not plastic; ANOVA one-way, [F(3,107)=6.720, P=.0003]. n = spines. A Bonferroni post-hoc test was applied where appropriate, *P < 0.05, ***P < 0.001. Error bars depict SEM.
Figure 5
Figure 5. SYNGAP1 Haploinsufficiency in young mice causes abnormal hippocampal signal processing, E/I imbalance and seizures
A-B) Time series data of voltage sensitive dye (VSD) imaging of responses to single-site photostimulation (indicated by the red star) in DG and near-simultaneous, multi-site photostimulation across DG (indicated by the red curve), respectively, from the same PND16 WT (a) or Het (b) slice. VSD frames were acquired at 2.2 ms/frame, but are displayed at specific time points. Time progresses from left to right in the row. Color code is used to indicate VSD signal amplitudes expressed as standard deviation (SD) multiples above the mean baseline. The warmer the color, the stronger the response. C) Average response amplitude in SD units for DG, CA3 and CA1 to single-site (left) and multi-site (right) DG photostimulation from WT (n=6) and Het (n=7) slices (four animals from each genotype); ANOVA two-way: Single Site [Genotype (F(1,33)=20.8, P=0.00007); Brain Region (F(2,33)=4.27, P=.022); Interaction (F(2,33)=5.12, P=0.011)], Multi-site [Genotype (F(1,33)=13.5, P=0.00083); Brain Region (F(2,33)=4.23, P=.023); Interaction (F(2,33)=7.20, P=0.0025)]. *p<0.05, **p<0.01, *** p<0.0005 after a Bonferroni post-hoc test. D) Representative traces and pooled data of input-output relationship from the Schaffer-collateral pathway in CA1 in developing and mature SynGAP mice. Significance was determined by comparison of slopes after linear regression. E) Time taken to reach three benchmarks in fluorothyl-induced seizures in PND17 Wt (n=25) and Het (n=21) mice [ANOVA; First Clonus (1st C): [F(1,42)=41.8, P<0.001], Tonic-Clonic (TC): [F(1,42)=46.5, P<0.001], Tonic Hindlimb Extension (THE): [F(1,42)=34.0, P<0.001]]. *p<0.001 F) Activity levels of PND16 WT (n=27) and Het (n=10) mice during an exposure to a novel open field arena; RMANOVA [F(1,33)=11.2, P=0.002]. Error bars depict SEM.
Figure 6
Figure 6. Adult SYNGAP1 Hets display learning deficits in a task selective for the Dentate Gyrus
A) Schematic depicting context discrimination paradigm. B) WT (n = 10) and Het (n = 12) mice in the multi-day training paradigm. Both groups showed a significant and equivalent increase in freezing in context A across sessions (main effect of session F(9, 180) = 31.7, p < .05, no effect of genotype F(1, 20) = 2.08, p > .05, no genotype × session interaction F < 1). C) WT mice learned to discriminate the shock context (A+) from the safe environment (B−) across 5 sessions (main effect of context F(1,9) = 7.05, p < .05, context × session interaction F(4, 36) = 3.35, p < .05). D) Hets did not learn to discriminate between the shock context and safe environment across 5 sessions (no effect of context F(1, 11) = 1.72, p > .05, no context × session interaction F(4, 44) = 2.13. p > .05). * p < 0.05.
Figure 7
Figure 7. Developing, but not adult, dendritic spine synapses are cell autonomously suppressed by SynGAP protein
A) Schematic depicting the strategy for temporal dissection of SYNAGAP1 haploinsufficiency on cell autonomous neuronal properties. Briefly, SYNGAP1 mice heterozygous for flanking LoxP (SYNGAP1+/fl) sites were crossed to homozygous Ai9 Cre reporter mice (TD+/+) and resulting offspring were injected with Cre virus at either PND1 or PND60. Whole-cell patch clamp recordings were carried out 14 days later. B) Photos were taken of an acute brain slice at PND14 with a mosaic expression of TdTomato+ neurons. Red box depicts a neuron that was successfully patched-clamped. C-D) Mean AMPA/NMDA ratios from either control (tdTomato-negative) or Cre+ (tdTomato-expressing) neurons patch-clamped in the two genotypes at the two developmental stages (neonatal = P<0.01; adults = p>0.05; Student’s t-test).
Figure 8
Figure 8. Rescuing SynGAP protein expression in adult mice has minimal impact on cognition and behavior
A) Experimental scheme - Hemizygous male Cre mice were mated with female heterozygous SYNGAP1 lox stop (rescue) mice to generate four different genotypes: Cre−/WT, Cre−/lx-st, Cre+/WT, Cre+/lx-st, which were run through a behavioral battery at 8 wks, administered TMX for 5 consecutive days, retested in the behavioral battery 1 month later, and brains extracted and prepared for Southern and Western blots. B) The mice were run for 30 min sessions in a standard open field test before and after TMX administrations and analyzed for distances traveled. Students T-test: [pre-TMX, Cre− (WT (n=11) vs. Het (n=16)); Cre+ (WT (n=11) vs. Het (n=10)); post-TMX: Cre− (WT (n=10) vs. Het (n=15)); Cre+ (WT (n=10) vs. Het (n=10)); **P<0.005, ***P<0.001]. C) The mice were run in a standard 5 min elevated plus maze test before and after TMX administrations and analyzed for percent time spent in the open arms of the maze. Students T-test: [pre-TMX, Cre− (WT (n=11) vs. Het (n=16)); Cre+ (WT (n=11) vs. Het (n=10)); post-TMX: Cre− (WT (n=10) vs. Het (n=15)); Cre+ (WT (n=10) vs. Het (n=10)); *P<0.05, ***P<0.001]. D) The mice were run in a standard automated discrete-trials spontaneous alternation test three times before and after TMX administrations and analyzed for average percent alternation. Cre−/WTs and Cre+/WTs alternated significantly above chance (50%) level before and after TMX administrations, while the corresponding het groups did not. Dashed line represents chance levels of alternation (50%). Students One-Sample T-test against population mean of 50%: [pre-TMX: Cre− (WT (n=11), Het (n=16)); Cre+ (WT (n=11), Het (n=10)); post-TMX: Cre− (WT (n=10) vs. Het (n=15)); Cre+ (WT (n=10) vs. Het (n=10)); *P<0.05, **P<0.005]. E) Frontal cortical brain tissue from all four groups of mice was dissected and processed for Southern blot analysis, which confirmed that TMX excised the LoxP-Stop cassette in adult Cre-ERt2 positive animals. Four subjects from each group were randomly chosen for genetic analysis. Lanes with asterisks were loaded with C57/Bl6 positive control genomic DNA. F) Hippocampal tissues from the mice were dissected and processed for Western blot analysis of SynGAP protein levels normalized to β-tubulin after TMX administrations and behavioral testing (n=7 per group; t-test, P<0.001).

References

    1. Ashby MC, Isaac JT. Maturation of a recurrent excitatory neocortical circuit by experience-dependent unsilencing of newly formed dendritic spines. Neuron. 2011;70:510–521. - PMC - PubMed
    1. Bear MF, Huber KM, Warren ST. The mGluR theory of fragile X mental retardation. Trends in neurosciences. 2004;27:370–377. - PubMed
    1. Bender RA, Dube C, Baram TZ. Febrile seizures and mechanisms of epileptogenesis: insights from an animal model. Advances in experimental medicine and biology. 2004;548:213–225. - PMC - PubMed
    1. Carlisle HJ, Manzerra P, Marcora E, Kennedy MB. SynGAP regulates steady-state and activity-dependent phosphorylation of cofilin. J Neurosci. 2008;28:13673–13683. - PMC - PubMed
    1. Chen HJ, Rojas-Soto M, Oguni A, Kennedy MB. A synaptic Ras-GTPase activating protein (p135 SynGAP) inhibited by CaM kinase II. Neuron. 1998;20:895–904. - PubMed

Publication types

Substances