. 2013 Jan 20;435(2):472-84.
doi: 10.1016/j.virol.2012.10.027. Epub 2012 Nov 9.

Modulation of hepatitis C virus RNA abundance and virus release by dispersion of processing bodies and enrichment of stress granules

Affiliations

Modulation of hepatitis C virus RNA abundance and virus release by dispersion of processing bodies and enrichment of stress granules

Cara T Pager et al. Virology. .

Abstract

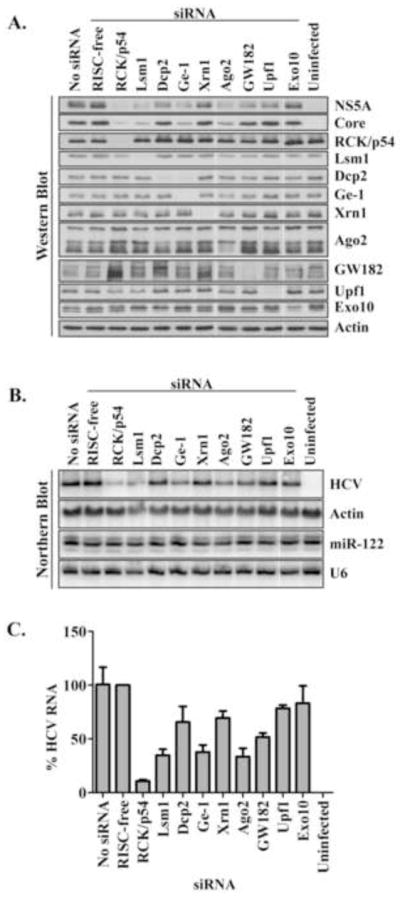
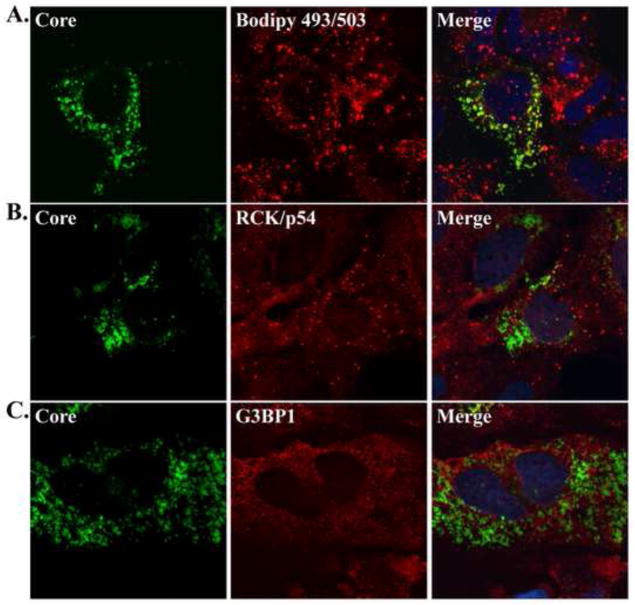
Components of cytoplasmic processing bodies (P-bodies) and stress granules can be subverted during viral infections to modulate viral gene expression. Because hepatitis C virus (HCV) RNA abundance is regulated by P-body components such as microRNA miR-122, Argonaute 2 and RNA helicase RCK/p54, we examined whether HCV infection modulates P-bodies and stress granules during viral infection. It was discovered that HCV infection decreased the number of P-bodies, but induced the formation of stress granules. Immunofluorescence studies revealed that a number of P-body and stress granule proteins co-localized with viral core protein at lipid droplets, the sites for viral RNA packaging. Depletion of selected P-body proteins decreased overall HCV RNA and virion abundance. Depletion of stress granule proteins also decreased overall HCV RNA abundance, but surprisingly enhanced the accumulation of infectious, extracellular virus. These data argue that HCV subverts P-body and stress granule components to aid in viral gene expression at particular sites in the cytoplasm.


Figures

Figure 1
Figure 1. Dispersion of P-bodies during JFH-1 infection
(A) Distribution of P-bodies. Huh7 cells were infected with JFH-1 virus and 3 days p.i., the distribution of P-bodies in uninfected and infected cells was examined by confocal microscopy. P-bodies and HCV-positive cells were identified by staining with specific antibodies detecting RCK/p54 (red) or HCV NS5A (green) proteins. Representative images are shown. (B) Number of P-bodies in uninfected and JFH-1-infected cells 1, 2, and 3 days p.i. The number of P-bodies was quantified using ImageJ software. Mean values and standard deviations of four independent experiments are shown, *** P<0.001 and ** P<0.002. (C) Abundances of P-body proteins (RCK/p54, Lsm1, Dcp1a, Dcp2, Ge-1, Xrn1, Ago2), and viral NS5A and core proteins in JFH-1 infected and uninfected Huh7 cells at 1, 2, and 3 days p.i. were examined by western blot analysis. The abundance of actin serves as a loading control.
Figure 2
Figure 2. Localization of RCK/p54, core and lipid droplets during JFH-1 infection
(A) Localization of RCK/p54 and lipid droplets in uninfected Huh7 cells. (B–D) Localization of RCK/p54, HCV core and lipid droplets in JFH-1 infected Huh7 cells 3 days p.i. Bodipy 493/503-was used to stain lipid droplets, and images were acquired with a Zeiss LSM5 confocal microscope. RCK/p54 (B, D) and HCV core (B) in the representative image have been re-colored image to show co-localization. The Pearson’s correlation coefficient (r) quantifying the degree of co-localization is presented in the merged images.
Figure 3
Figure 3. Effects of depletion of P-body proteins on JFH-1 protein and RNA abundances
Huh7 cells were depleted of P-body proteins and infected with JFH-1 virus. (A) Abundances of HCV NS5A and core proteins, and P-body proteins RCK/p54, Lsm1, Dcp2, Ge-1, Xrn1, Ago2, GW182, Upf1 and Exo10 during JFH-1 infection were examined by western blot analysis. Transfection reagent alone (no siRNA) and the transfection of a RISC-free siRNA were included as controls. (B) Abundances of HCV RNA and miR-122. Representative northern blots are shown. Actin mRNA and U6 snRNA were used as RNA loading controls. (C) Quantitation of HCV RNA. HCV RNA abundances were normalized to actin mRNA and to control RISC-free siRNA. Mean values and standard deviations from three independent experiments are shown.
Figure 4
Figure 4. Formation of stress granules during JFH-1 infection
(A) Induction of stress granules by arsenite and JFH-1 infection. Uninfected and JFH-1 infected Huh7 cells were treated without or with 1 mM arsenite for 30 minutes at 37ºC. Cells were fixed and stained with eIF3η (red) and HCV NS5A (green) specific antibodies. Representative confocal microscopy images are presented. White arrows point to examples of stress granules. (B) Induction of stress granules during JFH-1 infection 1, 2 and 3 days p.i. The appearance of stress granules in uninfected and JFH-1-infected Huh7 cells was quantified using ImageJ software. Mean values and standard deviations of three independent experiments are shown. (C) Abundances of NS5A, core, and stress granule proteins (TIA-1, TIAR, G3BP1, HuR, Ataxin2, and YB-1) from JFH-1 infected and uninfected Huh7 cells at 1, 2, and 3 days p.i. were examined by western blot analysis. Abundance of GAPDH serves as a control.
Figure 5
Figure 5. Localization of core, lipid droplets and stress granule proteins in JFH-1 infected cells
Localization of HCV core, lipid droplets and stress granule proteins (G3BP1, TIA-1 and USP10) in JFH-1 infected Huh7 cells was examined. Bodipy 493/503-was used to stain lipid droplets, and images were acquired with a Zeiss LSM5 confocal microscope. Representative images show the staining of HCV core (black and white), and co-staining of lipid droplets (green) and individual stress granule proteins (red). The Pearson’s correlation coefficient (r) quantifying the degree of co-localization between lipid droplets (Bodipy 493/503) and stress granules proteins is presented in the merged images.
Figure 6
Figure 6. Effects of depletion of stress granule proteins on JFH-1 protein and RNA abundances
(A) Abundances of stress granule proteins TIA-1, G3BP1, HuR, Ataxin2, USP10 and OGFOD1, and viral NS5A and core after siRNA-mediated depletion of stress granule proteins and JFH-1 infection. Western blots are shown. Transfection reagent alone (no siRNA) and the transfection of a RISC-free siRNA were included as controls. The abundance of GAPDH serves as a loading control. (B) Abundances of HCV RNA and miR-122 during depletion of stress granule proteins. Representative northern blots are shown. Actin mRNA and U6 snRNA were used as RNA loading controls. (C) Quantitation of HCV RNA. HCV RNA abundances were normalized to actin mRNA and to RISC-free siRNA. Mean values and standard deviations from three independent experiments are shown.
Figure 7
Figure 7. Localization of RCK/p54, G3BP1 and over-expressed HCV core protein
Distribution of RCK/p54, G3BP1 and over-expressed core protein in Huh7 cells. (A) Localization of lipid droplets (red) and core (green). (B) Localization of RCK/p54 (red) and core (green). (C) Localization of G3BP1 (red) and core (green). Lipid droplets were stained with the neutral lipid dye Bodipy 493/503. Individual and merged images are shown. Images have been re-colored for presentation.
Figure 8
Figure 8. Cell-associated and extracellular infectious JFH-1 yield following depletion of RCK/p54, Ge-1, TIA-1, G3BP1, HuR, Ataxin2, USP10 and OGFOD1
Virus yield in cells depleted of RCK/p54, Ge-1, TIA-1, G3BP1, HuR, Ataxin2, USP10 and OGFOD1 proteins. Virus yield was measured in (A) cells (cell-associated) or (B) extracellular medium (extracellular) using the limiting dilution infectivity assay as previously described (Lindenbach et al., 2005). The transfection of a RISC-free siRNA was included as a control. (C) Abundances of cell-associated core protein was determined by western blot analysis and ECF chemifluorescence. (D) Quantitation of extracellular core proteins was analyzed by ELISA. Mean values and standard deviations from three independent experiments are shown. HCV titer and abundance of core protein was normalized to JFH-1 infected cells transfected with the RISC-free siRNA.

References

    1. Adler J, Parmryd I. Quantifying colocalization by correlation: the Pearson correlation coefficient is superior to the Mander’s overlap coefficient. Cytometry A. 2010;77:733–742. - PubMed
    1. Anderson P, Kedersha N. RNA granules: post-transcriptional and epigenetic modulators of gene expression. Nat Rev Mol Cell Biol. 2009a;10:430–436. - PubMed
    1. Anderson P, Kedersha N. Stress granules. Curr Biol. 2009b;19:R397–398. - PubMed
    1. Ariumi Y, Kuroki M, Kushima Y, Osugi K, Hijikata M, Maki M, Ikeda M, Kato N. Hepatitis C virus hijacks P-body and stress granule components around lipid droplets. Journal of Virology. 2011;85:6882–6892. - PMC - PubMed
    1. Arnaud N, Dabo S, Maillard P, Budkowska A, Kalliampakou KI, Mavromara P, Garcin D, Hugon J, Gatignol A, Akazawa D, Wakita T, Meurs EF. Hepatitis C virus controls interferon production through PKR activation. PLoS One. 2010;5:e10575. - PMC - PubMed

Publication types

LinkOut - more resources