. 2012 Dec 28;48(6):900-13.
doi: 10.1016/j.molcel.2012.09.030. Epub 2012 Nov 8.

The deacetylase Sirt6 activates the acetyltransferase GCN5 and suppresses hepatic gluconeogenesis

Affiliations

The deacetylase Sirt6 activates the acetyltransferase GCN5 and suppresses hepatic gluconeogenesis

John E Dominy Jr et al. Mol Cell. .

Abstract

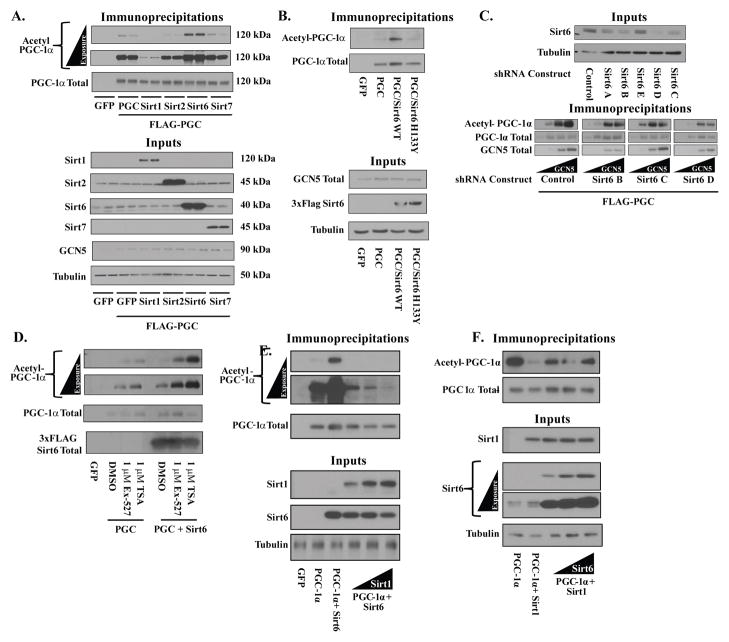
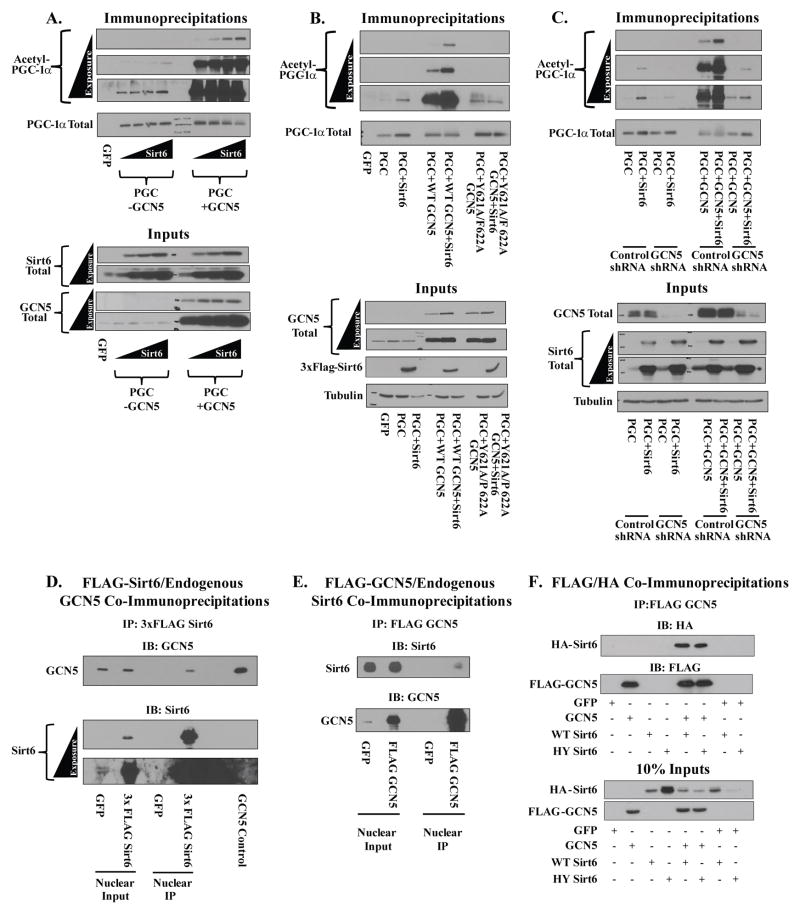
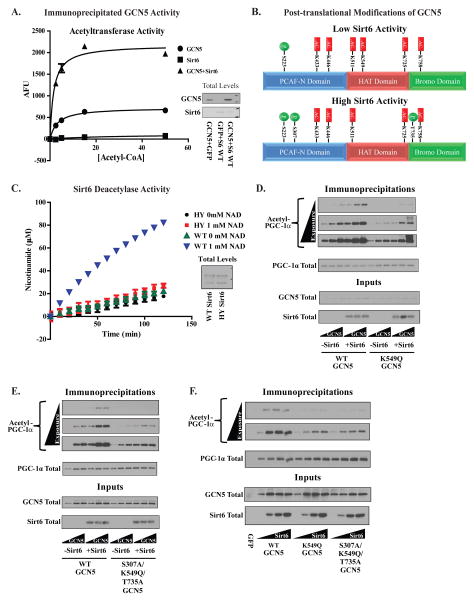
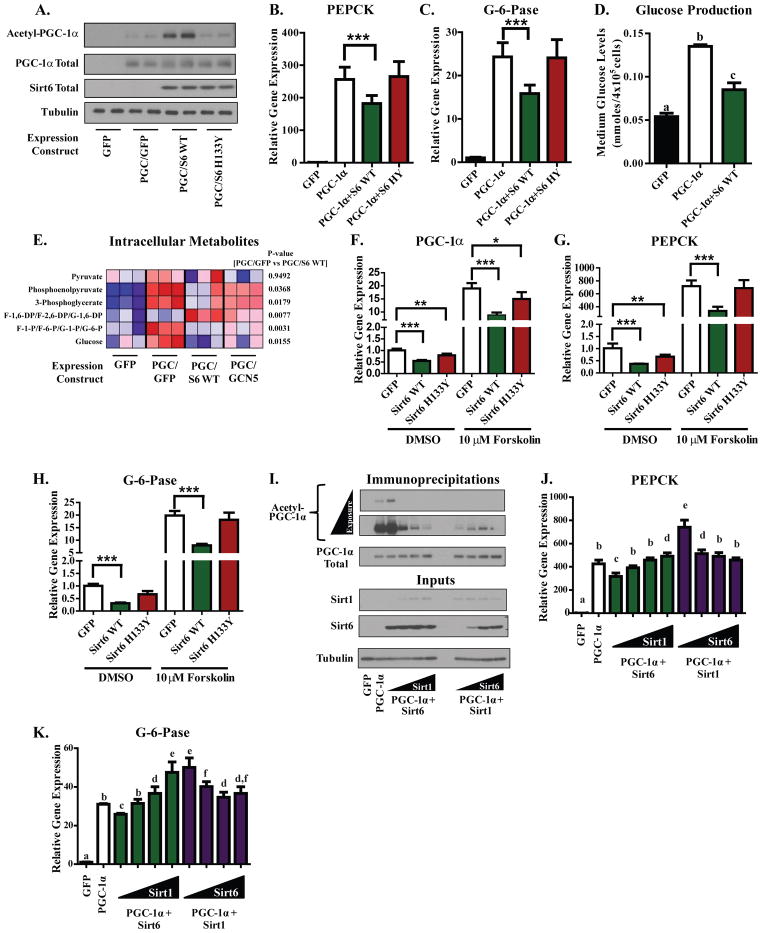
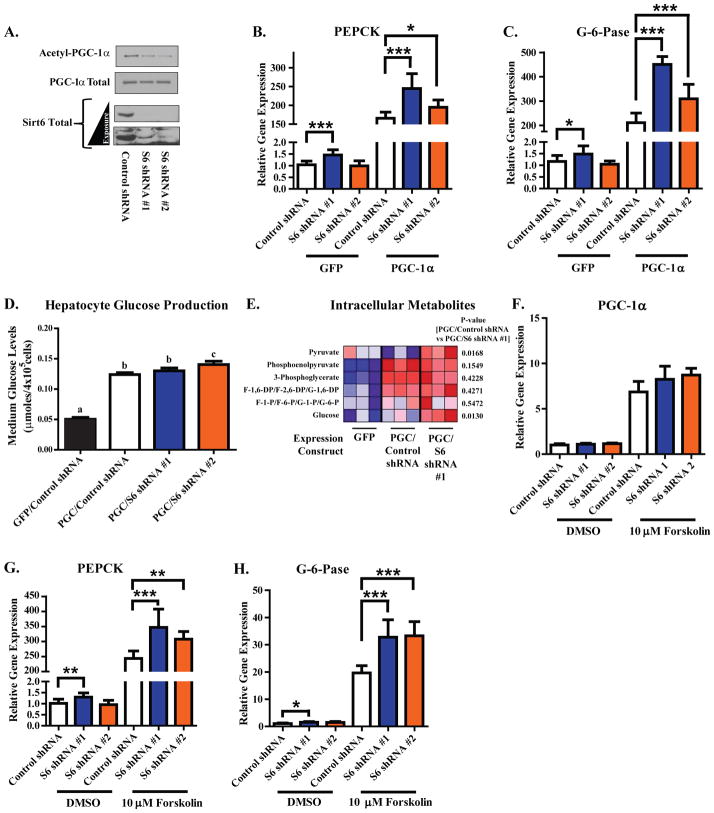
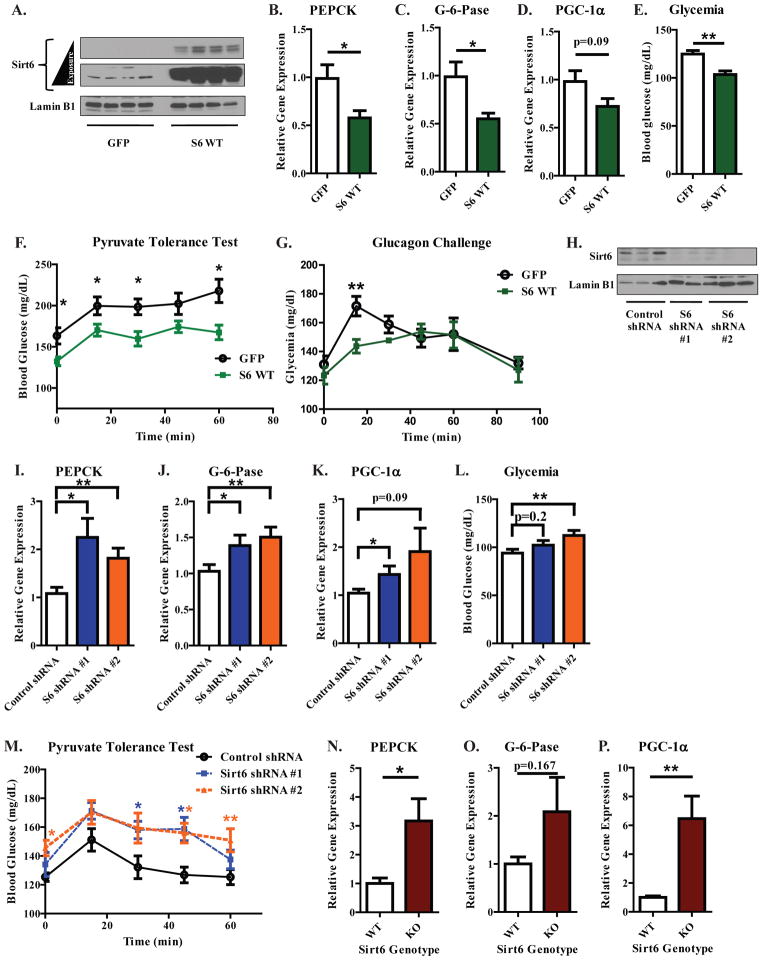
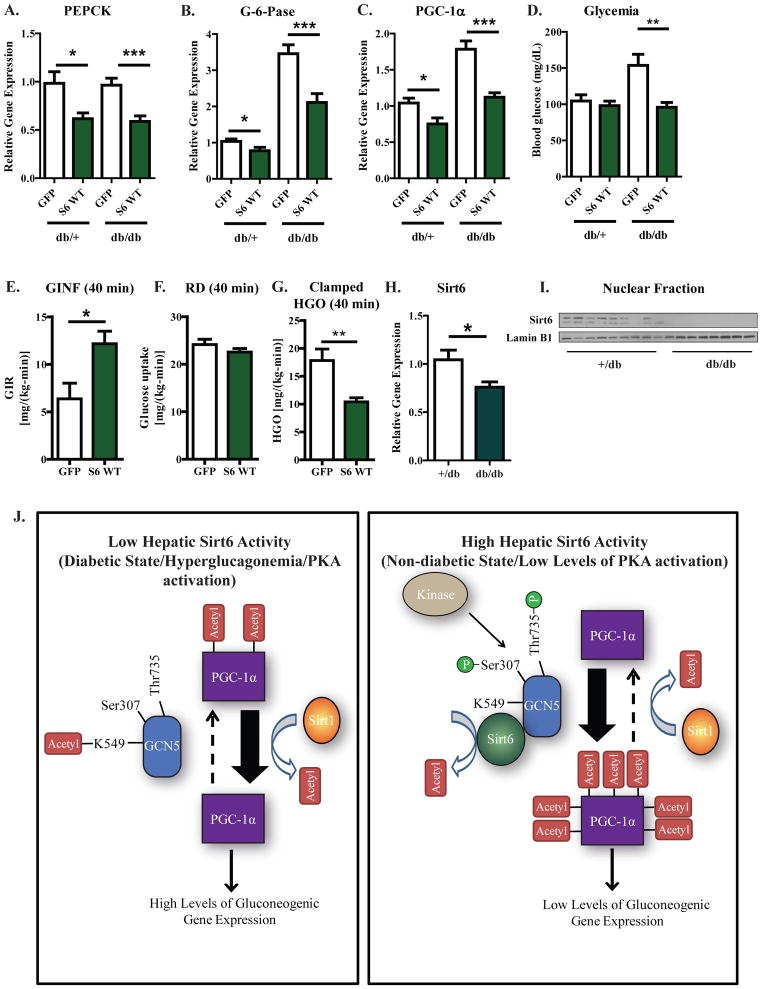
Hepatic glucose production (HGP) maintains blood glucose levels during fasting but can also exacerbate diabetic hyperglycemia. HGP is dynamically controlled by a signaling/transcriptional network that regulates the expression/activity of gluconeogenic enzymes. A key mediator of gluconeogenic gene transcription is PGC-1α. PGC-1α's activation of gluconeogenic gene expression is dependent upon its acetylation state, which is controlled by the acetyltransferase GCN5 and the deacetylase Sirt1. Nevertheless, whether other chromatin modifiers-particularly other sirtuins-can modulate PGC-1α acetylation is currently unknown. Herein, we report that Sirt6 strongly controls PGC-1α acetylation. Surprisingly, Sirt6 induces PGC-1α acetylation and suppresses HGP. Sirt6 depletion decreases PGC-1α acetylation and promotes HGP. These acetylation effects are GCN5 dependent: Sirt6 interacts with and modifies GCN5, enhancing GCN5's activity. Lepr(db/db) mice, an obese/diabetic animal model, exhibit reduced Sirt6 levels; ectopic re-expression suppresses gluconeogenic genes and normalizes glycemia. Activation of hepatic Sirt6 may therefore be therapeutically useful for treating insulin-resistant diabetes.


Figures

Figure 1
Figure 1. Sirt6 modulates PGC-1α acetylation in cultured cells
(A) Effects of ectopic nuclear sirtuin expression on PGC-1α acetylation. FLAG-HA-PGC-1α was immunoprecipitated from U-2 OS cells transfected with Sirt1, Sirt2, Sirt6, Sirt7 or GFP control and blotted for total acetylation. Molecular weights of detected proteins are indicated. (B) Mutation of catalytically essential residue H133 blocks Sirt6-induced PGC-1α acetylation. (C) Knockdown of endogenous Sirt6 reduces PGC-1α acetylation levels. (Top) Sirt6 expression in U-2 OS lines stably expressing either one control shRNA or one of five different Sirt6 shRNAs (Bottom) PGC-1α acetylation from three of the lowest Sirt6 expressing lines co-transfected with PGC-1α and increasing amounts of GCN5. (D) 16 h inhibition of Sirt1 or Class I/II HDACs fails to block Sirt6-induced PGC-1α acetylation. (E) PGC-1α acetylation from U-2 OS cells transfected with a fixed concentration of Sirt6 and increasing amounts of Sirt1. (F) PGC-1α acetylation from U-2 OS cells transfected with a fixed amount of Sirt1 and increasing amounts of Sirt6. See Figure S1.
Figure 2
Figure 2. Changing cellular GCN5 levels alters Sirt6’s ability to change PGC-1α acetylation
(A) Effects of GCN5 on Sirt6-mediated changes in PGC-1α acetylation. U-2 OS cultures were transfected with PGC-1α and increasing concentrations of Sirt6 with or without expression of WT GCN5. (B) Catalytically impaired GCN5 mutant, Y621A/F622A, fails to augment the Sirt6-mediated increase in PGC-1α acetylation (C) GCN5 knockdown diminishes the effect of Sirt6 on PGC-1α acetylation. (D) Co-IP of endogenous GCN5 with 3xFLAG Sirt6 from the nuclear fraction of U-2 OS cells. (E) Co-IP of endogenous Sirt6 with FLAG GCN5 from the nuclear fraction of U-2 OS cultures. (F) Co-IP of WT and HY Sirt6 with GCN5 from the nuclear fractions of U-2 OS cells.
Figure 3
Figure 3. Sirt6 increases GCN5’s acetyltransferase activity and alters the profile of post-translational modifications on GCN5 protein
(A) In vitro acetyltransferase activities of GCN5 immunoprecipitated from the nuclear fraction of U-2 OS cells with and without Sirt6. (B) Post-translational modifications mapped by mass spectrometry on GCN5 immunoprecipitated from U-2 OS transfected with empty vector (top panel) or WT Sirt6 (bottom panel). Phosphorylated residues are indicated in green and acetylated residues in red. 49% sequence coverage was obtained in these experiments (C) Measurement of the in vitro deacetylation of a peptide containing acetyl-K549 using nicotinamide production as an indicator of deacetylase activity. WT Sirt6 and H133Y Sirt6 were immunoprecipitated from U-2 OS infected with adenoviral constructs. (D) A test of WT and K549Q GCN5’s effects on PGC-1α acetylation in the presence/absence of Sirt6 expression. Increasing concentrations of GCN5 construct were transfected along with a fixed concentration of Sirt6 and PGC-1α. (E) Evaluation of WT and S307A/K549Q/T735A GCN5’s effects on PGC-1α acetylation in the presence/absence of Sirt6. Experimental setup was identical to that shown in Figure (D). (F) Comparison of sensitivities of WT, K549Q and S307A/K549Q/T735A GCN5 to increasing concentrations of Sirt6 using acetylated PGC-1α. GCN5 and PGC-1α were transfected into U-2 OS cells at a fixed concentration along with Sirt6 at increasing concentrations. Data are means±S.E.M. See Figures S2,3.
Figure 4
Figure 4. Sirt6 elevates PGC-1α acetylation in murine primary hepatocyte cultures and suppresses the gluconeogenic program in direct opposition to Sirt1
(A) Measurement of PGC-1α acetylation in murine primary hepatocyte cultures expressing GFP, WT Sirt6, or H133Y Sirt6. (B,C) Assessment of PEPCK (B) and G-6-Pase (C) mRNA levels in murine primary hepatocyte cultures expressing the indicated constructs. In Figures (A–C), data are a composite of three separate experiments. (D) PGC-1α-induced glucose production in primary hepatocytes co-expressing either GFP or Sirt6. Data are an average of two independent experiments. Columns with different letters above them are statistically significant. (E) Heat map depicting LC-MS analysis of intracellular metabolites from primary hepatocytes expressing the indicated constructs. (F–H) Assessment of PGC-1α (F), PEPCK (G), and G-6-Pase (H) mRNA levels in primary hepatoctyes infected with GFP, WT Sirt6, or H133Y Sirt6 expression constructs and treated for 1.5 h with DMSO vehicle or 10 μM forskolin. In Figures (F–H), data are pooled from three independent experiments. (I) Competitive effects of Sirt6 and Sirt1 on PGC-1α acetylation in primary hepatocytes. Cultures were infected with a fixed dose of one sirtuin while the amount of the other was progressively increased (total viral infection was equal across all treatments). (J,K) Gluconeogenic gene expression from the experimental setup in (I). Data are from two independent experiments. Columns with different letters above them are statistically significant (p<0.05). All data expressed as means±S.E.M. and analyzed by one-way ANOVA with a Tukey’s post-test. See Figure S4.
Figure 5
Figure 5. Reduction of endogenous Sirt6 decreases PGC-1α acetylation and enhances the gluconeogenic program of murine primary hepatocytes
(A) Assessment of PGC-1α acetylation and Sirt6 protein levels in murine primary hepatoctyes infected with the indicated adenoviral shRNA-expression constructs. (B,C) qRT-PCR measurement of PEPCK (B) and G-6-Pase (C) mRNA levels in primary hepatoctyes infected with GFP or PGC-1α and the indicated shRNA constructs. Data in Figures (A–C) are from three independent experiments. (D) Glucose production in primary hepatocytes infected with either GFP or PGC-1α and the indicated shRNA constructs. Data are pooled from two independent experiments. Columns with different letters above them are statistically significant (p<0.05). (E) Heat map depicting LC-MS analysis of intracellular metabolites from primary hepatocytes expressing the indicated constructs. (F–H) Measurement of PGC-1α (F), PEPCK (G), and G-6-Pase (H) mRNA levels in primary hepatoctyes infected with the indicated shRNA expression constructs and treated for 1.5 h with DMSO vehicle or 10 μM forskolin. In Figures (F–H), data are pooled from three independent experiments. All data expressed as means±S.E.M. *-p<0.05; **-p<0.01; ***-p<0.001 by one-way ANOVA with a Tukey’s post-test. See Figure S4.
Figure 6
Figure 6. Hepatic Sirt6 levels regulate the gluconeogenic transcriptional response of fasted C57BL/6 mice
(A) Hepatic Sirt6 protein levels from mice injected with either GFP or 3xFLAG WT Sirt6 adenoviruses. Mice were fed ad libitum for 4 days after injection and then fasted for 16 h before being sacrificed. (B–D) Hepatic gene expression data for PEPCK (B), G-6-Pase (C), and PGC-1α (D). (E) Blood glucose levels from mice infected with the indicated constructs (A). Figures (A–E) were compiled from two independent experiments (N=8–9 mice per treatment group) and analyzed by a two-tailed unpaired t-test. (F) Effect of hepatic Sirt6 over-expression on a pyruvate tolerance test (N=8 per group, analyzed by a two-tailed unpaired t-test). (G) Effect of hepatic Sirt6 over-expression on glucagon-induced changes in glycemia (N=8 per treatment group, analyzed by a two-tailed unpaired t-test). (H) Hepatic Sirt6 protein levels from mice receiving a tail-vein injection of the indicated adenoviral shRNA constructs. Mice were fed ad libitum for 3 days after injection and then fasted for 15 h before being sacrificed. (I–K) Hepatic PEPCK (I), G-6-Pase (J), and PGC-1α (K) mRNA levels from mice treated as in (H). (L) Blood glucose levels from mice treated as in Figure (H). Figures (H–L) were compiled from two separate experiments (N=13–14 mice per treatment group; analyzed by one-way ANOVA with Dunnet’s post-test). (M) Effect of hepatic Sirt6 knockdown on a pyruvate tolerance test (N=8 per treatment group; analyzed by one-way ANOVA with Dunnet’s post-test). See Figure S5.
Figure 7
Figure 7. Sirt6 suppresses the gluconeogenic program and reduces blood glucose levels in diabetic db/db mice
(A–C) Hepatic PEPCK (A), G-6-Pase (B), and PGC-1α (C) mRNA levels from +/db and db/db mice injected with GFP or 3×FLAG WT Sirt6-expressing adenovirus. For 3–4 days after tail vein injection of virus, mice were fed ad libitum and then fasted for 16 h before being sacrificed. (D) Blood glucose levels measured from mice treated as in (A). (E–G) Hyperinsulinemic-euglycemic clamp data from db/db mice injected with GFP or 3×FLAG WT Sirt6 virus. Clamped glucose infusion rate (E), glucose uptake (F), and hepatic glucose production (G) are shown. (F) Hepatic levels of endogenous Sirt6 mRNA in GFP-infected control mice treated as in (A). (G) Hepatic levels of endogenous Sirt6 protein in GFP-infected control mice treated as in (A). In Figures (A–D), results are data pooled from two independent experiments; N=15 for GFP injected +/db mice, N=10 for Sirt6 injected +/db mice, N=13 for GFP injected db/db mice, N=12 for Sirt6 injected db/db mice. In Figures (E–G), data are from 6-GFP injected and 7-Sirt6 injected mice and analyzed by a two-tailed unpaired t-test. (J) A model for how Sirt6 is able to regulate the acetylation state of PGC-1α and the gluconeogenic program of hepatoctyes. Left—when hepatic Sirt6 activity is low, GCN5 is acetylated at K549 and residues Ser307 and Thr735 are unphosphorylated. In this state, GCN5 activity is low. This, coupled with the action of Sirt1, results in low levels of PGC-1α acetylation, high levels of PGC-1α activity, and an activation of gluconeogenic gene expression. Right—when hepatic Sirt6 activity is high, GCN5 is deacetylated at K549 and residues Ser307 and Thr735 are phosphorylated. In this modified state, GCN5 activity is enhanced and exceeds the rate of Sirt1-mediated deacetylation, resulting in high levels of PGC-1α acetylation, reduced levels of PGC-1α activity, and a decrease in gluconeogenic gene expression. See Figures S6,7 and Table S1.

Similar articles

Cited by

References

    1. Burgess RJ, Zhou H, Han J, Zhang Z. A role for Gcn5 in replication-coupled nucleosome assembly. Mol Cell. 2010;37:469–480. - PMC - PubMed
    1. Canto C, Gerhart-Hines Z, Feige JN, Lagouge M, Noriega L, Milne JC, Elliott PJ, Puigserver P, Auwerx J. AMPK regulates energy expenditure by modulating NAD+ metabolism and SIRT1 activity. Nature. 2009;458:1056–1060. - PMC - PubMed
    1. Coste A, Louet JF, Lagouge M, Lerin C, Antal MC, Meziane H, Schoonjans K, Puigserver P, O’Malley BW, Auwerx J. The genetic ablation of SRC-3 protects against obesity and improves insulin sensitivity by reducing the acetylation of PGC-1{alpha} Proc Natl Acad Sci U S A. 2008;105:17187–17192. - PMC - PubMed
    1. Efendic S, Karlander S, Vranic M. Mild type II diabetes markedly increases glucose cycling in the postabsorptive state and during glucose infusion irrespective of obesity. J Clin Invest. 1988;81:1953–1961. - PMC - PubMed
    1. Gerhart-Hines Z, Dominy JE, Jr, Blattler SM, Jedrychowski MP, Banks AS, Lim JH, Chim H, Gygi SP, Puigserver P. The cAMP/PKA pathway rapidly activates SIRT1 to promote fatty acid oxidation independently of changes in NAD(+) Mol Cell. 2011;44:851–863. - PMC - PubMed

Publication types

MeSH terms