

Toxicodynamics of rigid polystyrene microparticles on pulmonary gas exchange in mice: implications for microemboli-based drug delivery systems
- PMID: 23142466
- PMCID: PMC3586786
- DOI: 10.1016/j.taap.2012.10.021
Toxicodynamics of rigid polystyrene microparticles on pulmonary gas exchange in mice: implications for microemboli-based drug delivery systems
Abstract
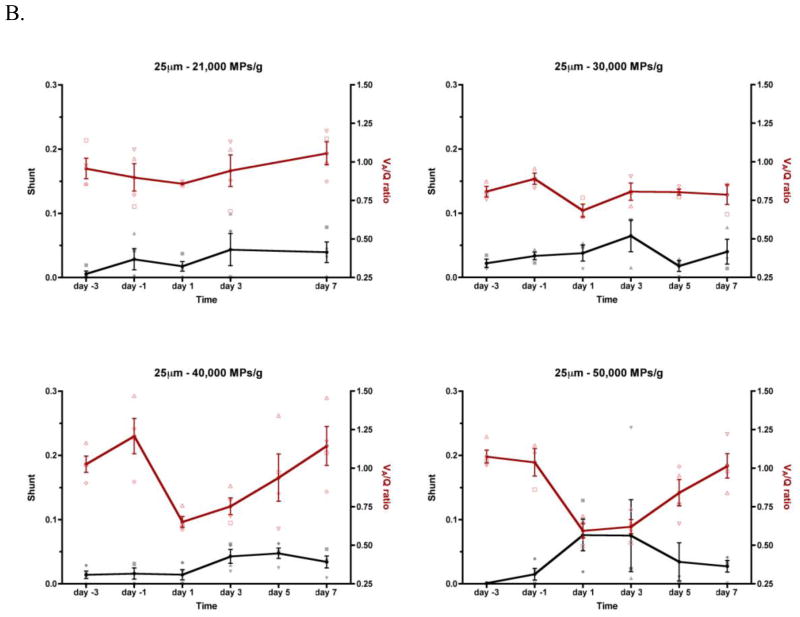
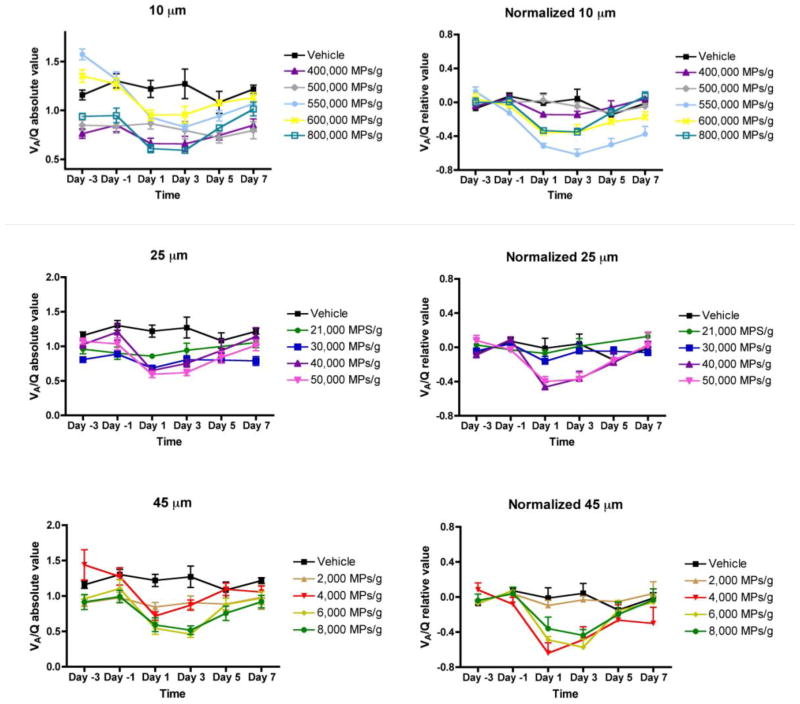
The toxicodynamic relationship between the number and size of pulmonary microemboli resulting from uniformly sized, rigid polystyrene microparticles (MPs) administered intravenously and their potential effects on pulmonary gas exchange were investigated. CD-1 male mice (6-8 weeks) were intravenously administered 10, 25 and 45 μm diameter MPs. Oxygen hemoglobin saturation in the blood (SpO(2)) was measured non-invasively using a pulse oximeter while varying inhaled oxygen concentration (F(I)O(2)). The resulting data were fit to a physiologically based non-linear mathematical model that estimates 2 parameters: ventilation-perfusion ratio (V(A)/Q) and shunt (percentage of deoxygenated blood returning to systemic circulation). The number of MPs administered prior to a statistically significant reduction in normalized V(A)/Q was dependent on particle size. MP doses that resulted in a significant reduction in normalized V(A)/Q one day post-treatment were 4000, 40,000 and 550,000 MPs/g for 45, 25 and 10 μm MPs, respectively. The model estimated V(A)/Q and shunt returned to baseline levels 7 days post-treatment. Measuring SpO(2) alone was not sufficient to observe changes in gas exchange; however, when combined with model-derived V(A)/Q and shunt early reversible toxicity from pulmonary microemboli was detected suggesting that the model and physical measurements are both required for assessing toxicity. Moreover, it appears that the MP load required to alter gas exchange in a mouse prior to lethality is significantly higher than the anticipated required MP dose for effective drug delivery. Overall, the current results indicate that the microemboli-based approach for targeted pulmonary drug delivery is potentially safe and should be further explored.
Copyright © 2012 Elsevier Inc. All rights reserved.
Figures


Similar articles
-
Pulmonary targeting microparticulate camptothecin delivery system: anticancer evaluation in a rat orthotopic lung cancer model.Anticancer Drugs. 2010 Jan;21(1):65-76. doi: 10.1097/CAD.0b013e328332a322. Anticancer Drugs. 2010. PMID: 19966540 Free PMC article.
-
Gas exchange and regional redistribution of pulmonary blood flow during resuscitation of acute pulmonary bead embolization.Pulm Pharmacol. 1992 Dec;5(4):273-8. doi: 10.1016/0952-0600(92)90070-w. Pulm Pharmacol. 1992. PMID: 1477483
-
Enhanced passive pulmonary targeting and retention of PEGylated rigid microparticles in rats.Int J Pharm. 2010 Dec 15;402(1-2):64-71. doi: 10.1016/j.ijpharm.2010.09.020. Epub 2010 Sep 29. Int J Pharm. 2010. PMID: 20883756 Free PMC article.
-
Retinal oximetry and systemic arterial oxygen levels.Acta Ophthalmol. 2018 Nov;96 Suppl A113:1-44. doi: 10.1111/aos.13932. Acta Ophthalmol. 2018. PMID: 30460761 Review.
-
Pulmonary Embolism and Gas Exchange.Respiration. 2019;98(3):253-262. doi: 10.1159/000501342. Epub 2019 Aug 7. Respiration. 2019. PMID: 31390642 Review.
Cited by
-
Using a non-invasive assessment of lung injury in a murine model of acute lung injury.BMJ Open Respir Res. 2014 Jan 3;1(1):e000014. doi: 10.1136/bmjresp-2013-000014. eCollection 2014. BMJ Open Respir Res. 2014. PMID: 25478170 Free PMC article.
-
Pharmaceutical and toxicological properties of engineered nanomaterials for drug delivery.Annu Rev Pharmacol Toxicol. 2014;54:581-98. doi: 10.1146/annurev-pharmtox-010611-134615. Epub 2013 Oct 23. Annu Rev Pharmacol Toxicol. 2014. PMID: 24160695 Free PMC article. Review.
-
In vivo evidence of methamphetamine induced attenuation of brain tissue oxygenation as measured by EPR oximetry.Toxicol Appl Pharmacol. 2014 Mar 1;275(2):73-8. doi: 10.1016/j.taap.2013.12.023. Epub 2014 Jan 8. Toxicol Appl Pharmacol. 2014. PMID: 24412707 Free PMC article.
-
A biodegradable nanoparticle platform for the induction of antigen-specific immune tolerance for treatment of autoimmune disease.ACS Nano. 2014 Mar 25;8(3):2148-60. doi: 10.1021/nn405033r. Epub 2014 Feb 27. ACS Nano. 2014. PMID: 24559284 Free PMC article.
References
-
- Aboab J, Louis B, Jonson B, Brochard L. Relation between PaO2/FIO2 ratio and FIO2: a mathematical description. Intensive Care Med. 2006;32:1494–1497. - PubMed
-
- Davis MA. Particulate Radiopharmaceuticals for Pulmonary Studies. In: Subramanian G, Rhodes BA, Cooper JF, Sodd VJ, editors. Radiopharmaceuticals. Society of Nuclear Medicine; New York: 1975. pp. 267–281.
-
- Ganong WF. Review of medical physiology. McGraw-Hill Medical; New York; London: 2005.
Publication types
MeSH terms
Substances
Grants and funding
- R01 CA132624/CA/NCI NIH HHS/United States
- T32 ES007148/ES/NIEHS NIH HHS/United States
- R01CA132624/CA/NCI NIH HHS/United States
- U54 AR055073/AR/NIAMS NIH HHS/United States
- R01CA155061/CA/NCI NIH HHS/United States
- U54AR055073/AR/NIAMS NIH HHS/United States
- P30ES005022/ES/NIEHS NIH HHS/United States
- R01 ES004738/ES/NIEHS NIH HHS/United States
- P30 ES005022/ES/NIEHS NIH HHS/United States
- R01ES004738/ES/NIEHS NIH HHS/United States
- 5T32ES007148/ES/NIEHS NIH HHS/United States
- R01 CA155061/CA/NCI NIH HHS/United States
LinkOut - more resources
Full Text Sources
Other Literature Sources
Medical
