. 2012 Nov 29;2(5):1197-206.
doi: 10.1016/j.celrep.2012.10.012. Epub 2012 Nov 8.

DNA binding by GATA transcription factor suggests mechanisms of DNA looping and long-range gene regulation

Affiliations

DNA binding by GATA transcription factor suggests mechanisms of DNA looping and long-range gene regulation

Yongheng Chen et al. Cell Rep. .

Abstract

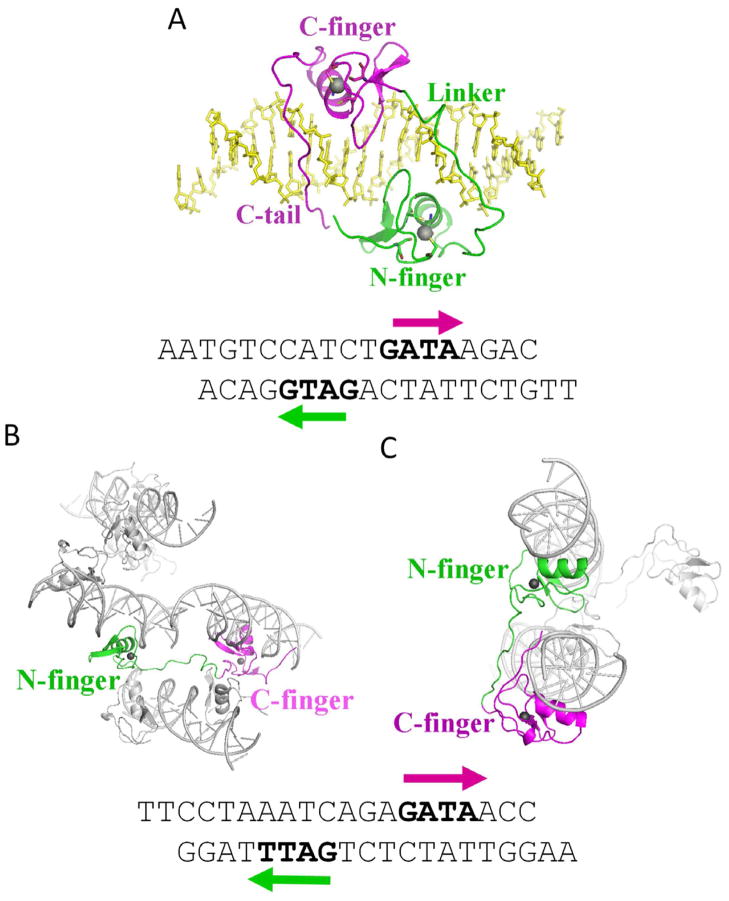
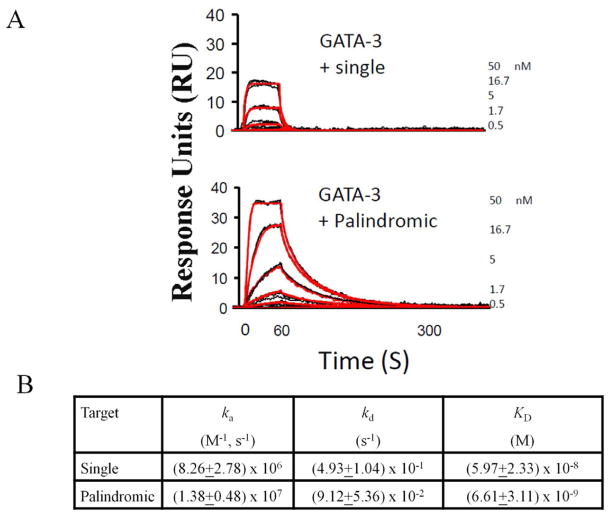
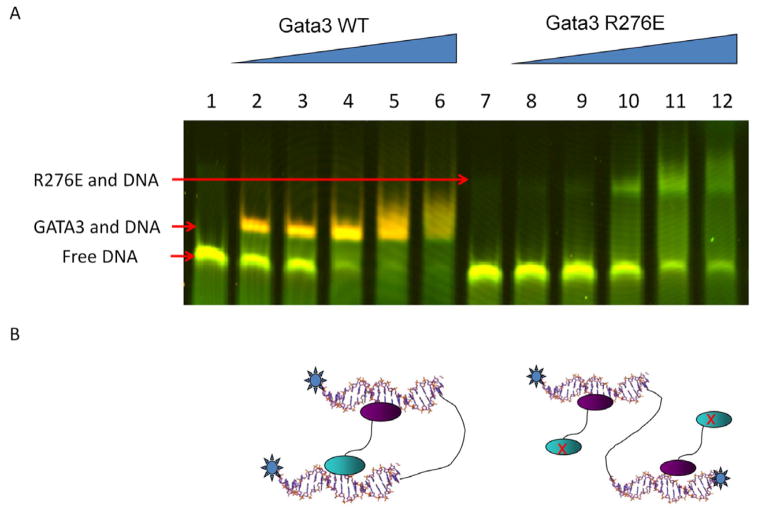
GATA transcription factors regulate transcription during development and differentiation by recognizing distinct GATA sites with a tandem of two conserved zinc fingers, and by mediating long-range DNA looping. However, the molecular basis of these processes is not well understood. Here, we determined three crystal structures of the full DNA-binding domain (DBD) of human GATA3 protein, which contains both zinc fingers, in complex with different DNA sites. In one structure, both zinc fingers wrap around a palindromic GATA site, cooperatively enhancing the binding affinity and kinetic stability. Strikingly, in the other two structures, the two fingers of GATA DBD bind GATA sites on different DNA molecules, thereby bridging two separate DNA fragments. This was confirmed in solution by an in-gel fluorescence resonance energy transfer analysis. These findings not only provide insights into the structure and function of GATA proteins but also shed light on the molecular basis of long-range gene regulation.


Conflict of interest statement

Conflict of Interest

The authors declare no competing financial interests.

Figures

Figure 1
Figure 1
Overall structures of GATA3/DNA complexes. (A) The structure of Complex 1. The N-finger and the linker are colored in green, the C-finger and C-tail are colored in magenta, and the DNA is colored in yellow. (B) The structure of Complex 2. Complexes of GATA3 N-/C-fingers bound to DNA from neighbouring asymmetric units are shown to illustrate one GATA3 protein bridging two pieces of DNA. One N-finger is colored in green, the C-finger of the same GATA protein is colored in magenta, while all the other molecules are colored in gray. (C) on the structure of Complex 3. Again, complexes of GATA3 N-/C-fingers bound to DNA from neighbouring asymmetric units are shown to illustrate DNA bridging by GATA3 protein, and the same color scheme is used as described in (B). The sequences of the DNA are listed below. (See also Supplementary Figure S1 and Supplementary Table S1).
Figure 2
Figure 2
DNA recognition by the GATA3 DBD. (A) Arg367 binds DNA only in the wrapping mode (Complex 1). These interactions are stabilized through the interaction between the Arg277 guanidinium group and the Lys368 backbone, reducing the conformational flexibility of the C-terminal tip. The electron density is calculated from a composite omit map. (B) Hydrogen bonding interactions among Arg276, Asn286 (N-finger) and three base pairs (GAT) of the binding site at their major groove core. These hydrogen bonds, in particular the bidentate hydrogen bond of the Arg276 guanidinium group with guanine, lead to the specific recognition of the base pair identity. (C) A network of hydrogen bonding interactions, similar to the one shown in (B), including a bidentate hydrogen bond, is formed between Arg330, Asn340 (C-finger), and three base pairs (GAT) of the binding site at their major groove core. (D) Arg365 forms hydrogen bonds with the minor groove edge of a base. Since these base readout interactions in the minor groove are not as specific as in the major groove, the negative electrostatic potential enhanced through the narrow minor groove stabilizes interactions with argine residues (shape readout; see also Supplementary Figure S2).
Figure 3
Figure 3
Schematic representation of DNA contacts with GATA3 amino acids in Complex 1 on the palindromic site. The hydrogen bonds are indicated by blue dotted lines, while hydrophobic contacts are indicated by red dash lines. The protein/DNA contact diagram is generated by NUCPLOT (Luscombe et al., 1997). The contact map demonstrates that GATA3 contacts the DNA in both the major and minor groove and employs base and shape readout mechanisms.
Figure 4
Figure 4
Superposition of zinc finger motifs displaying the varying linker conformations. In one representation (A), the N-fingers from the three complexes are superimposed, while in a different representaion (B), the C-fingers from the three complexes are superimposed. (C) Superposition of the N-finger and C-finger in Complex 1. P304 push the linker region away from the minor groove, while K358 pull the C-tail close to the minor groove throuth its interaction with C321. The DNA is visualized as orange ribbon. (see also Supplementary Figures S3 and S4).
Figure 5
Figure 5
Biacore analyses. (A) The sensorgrams showing kinetic analysis of GATA3 DBD with either single GATA site (top) or a palindromic site (bottom). Black lines represent triplicate injections performed in random order over the indicated DNA surface. A 1-min association was followed by a 5-min dissociation phase. Red lines represent the global fit of data sets using CLAMP. (B) Association rate constants ka, dissociation rate constants kd, and equilibrium constants KD=ka/kd demonstrate the kinetics of GATA3 DBD binding to either a single or palindromic GATA site. Standard error of the mean is indicated. The dissociation rates of single and palindromic sites are significantly different (p<0.05).
Figure 6
Figure 6
In-gel FRET analysis of DNA looping by GATA3 in solution. (A) GATA3 N-/C-fingers can bringe two binding sites into close proximity despite their separation in sequence. Pseudo-colored image showing a superposition of the fluorescence of the Cy3-donor (green) and the fluorescence of the Cy5-acceptor (red) fluorophores. Labels to the left indicate the respective protein/DNA species. Lanes 1–6 show the binding of wild-type GATA3 to DNA, while lanes 7–12 show the binding of a GATA3 mutant R276E, which abolishes N-finger DNA binding. (B) Cartoons represent models of the distinct overall architecture corresponding to the two protein shifts. The N-finger is displayed as a cyan oval and the C-finger as a purple oval.

References

    1. Adams PD, Grosse-Kunstleve RW, Hung LW, Ioerger TR, McCoy AJ, Moriarty NW, Read RJ, Sacchettini JC, Sauter NK, Terwilliger TC. PHENIX: building new software for automated crystallographic structure determination. Acta Crystallogr D Biol Crystallogr. 2002;58:1948–1954. - PubMed
    1. Bain DL, Heneghan AF, Connaghan-Jones KD, Miura MT. Nuclear Receptor Structure: Implications for Function. Annual Review of Physiology. 2007;69:201–220. - PubMed
    1. Bandukwala Hozefa S, Wu Y, Feuerer M, Chen Y, Barboza B, Ghosh S, Stroud James C, Benoist C, Mathis D, Rao A, et al. Structure of a Domain-Swapped FOXP3 Dimer on DNA and Its Function in Regulatory T Cells. Immunity. 2011;34:479–491. - PMC - PubMed
    1. Bates DL, Chen Y, Kim G, Guo L, Chen L. Crystal Structures of Multiple GATA Zinc Fingers Bound to DNA Reveal New Insights into DNA Recognition and Self-Association by GATA. Journal of molecular biology. 2008;381:1292–1306. - PMC - PubMed
    1. Brunger AT, Adams PD, Clore GM, DeLano WL, Gros P, Grosse-Kunstleve RW, Jiang JS, Kuszewski J, Nilges M, Pannu NS, et al. Crystallography & NMR system: A new software suite for macromolecular structure determination. Acta Crystallogr D Biol Crystallogr. 1998;54:905–921. - PubMed

Publication types

LinkOut - more resources