. 2013 Jan;154(1):159-71.
doi: 10.1210/en.2012-1835. Epub 2012 Nov 9.

Obesity-related alterations in cardiac lipid profile and nondipping blood pressure pattern during transition to diastolic dysfunction in male db/db mice

Affiliations

Obesity-related alterations in cardiac lipid profile and nondipping blood pressure pattern during transition to diastolic dysfunction in male db/db mice

Vincent G Demarco et al. Endocrinology. 2013 Jan.

Abstract

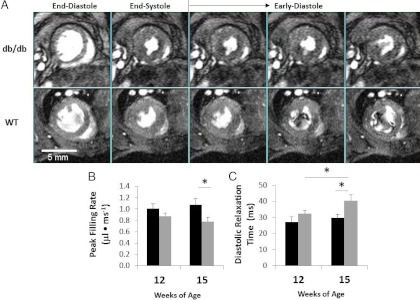
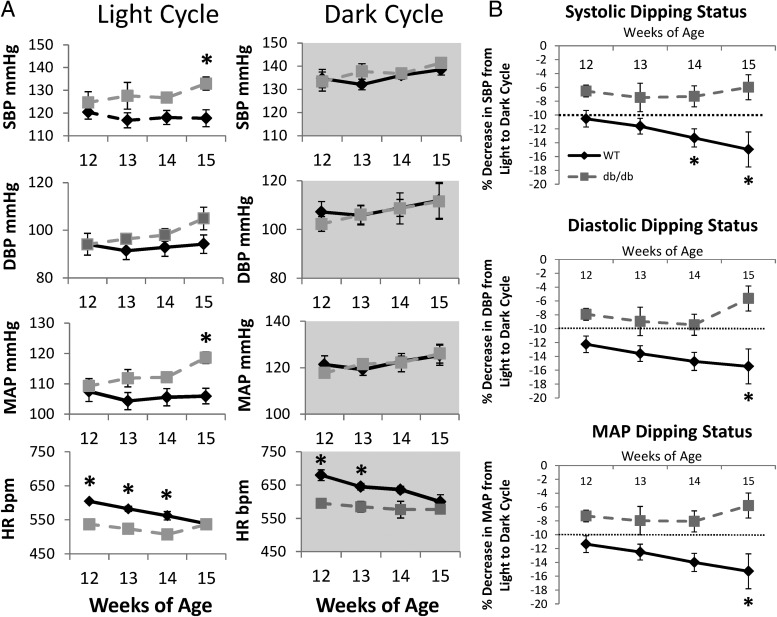
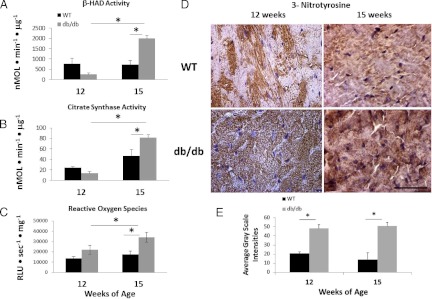
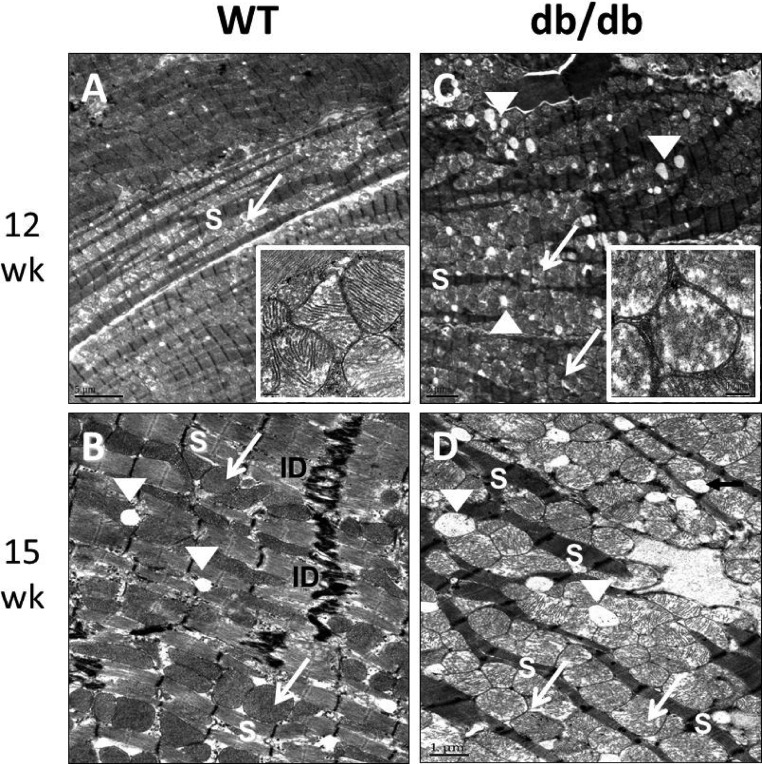
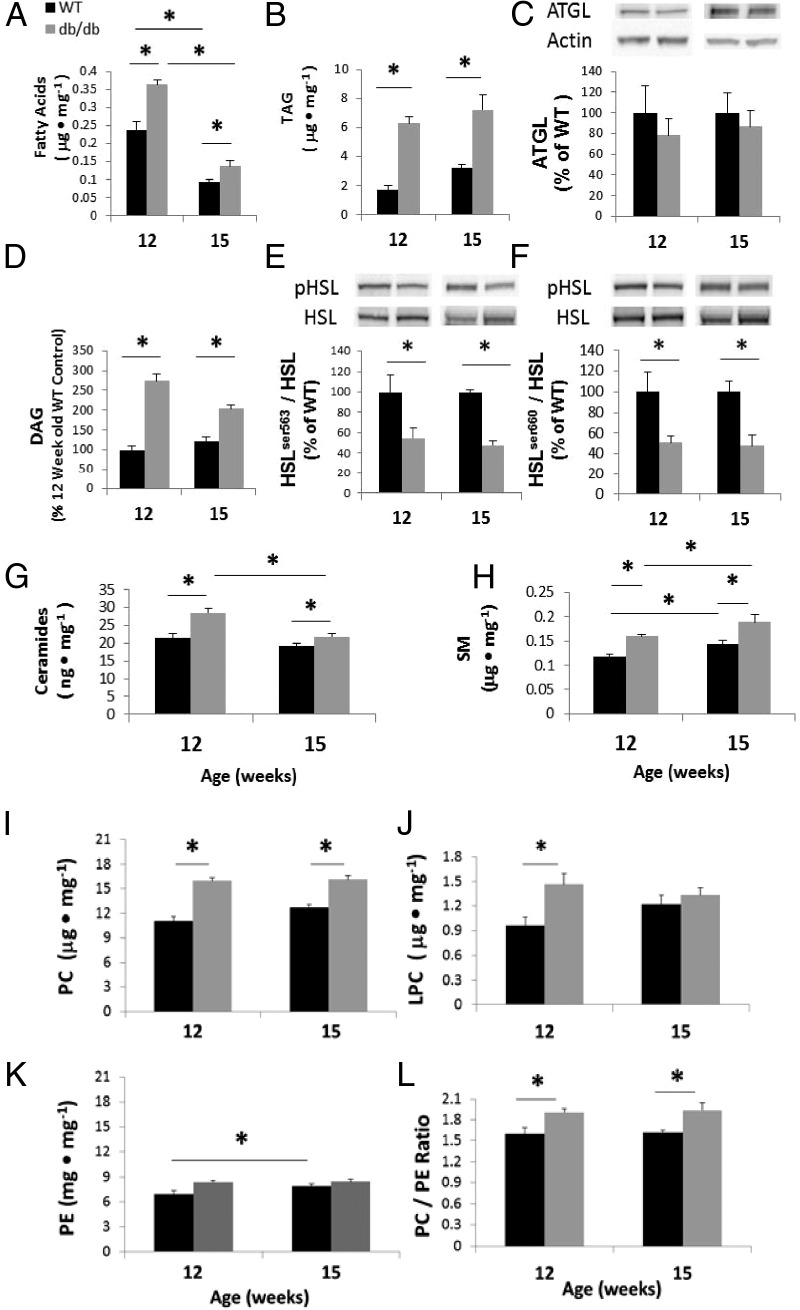
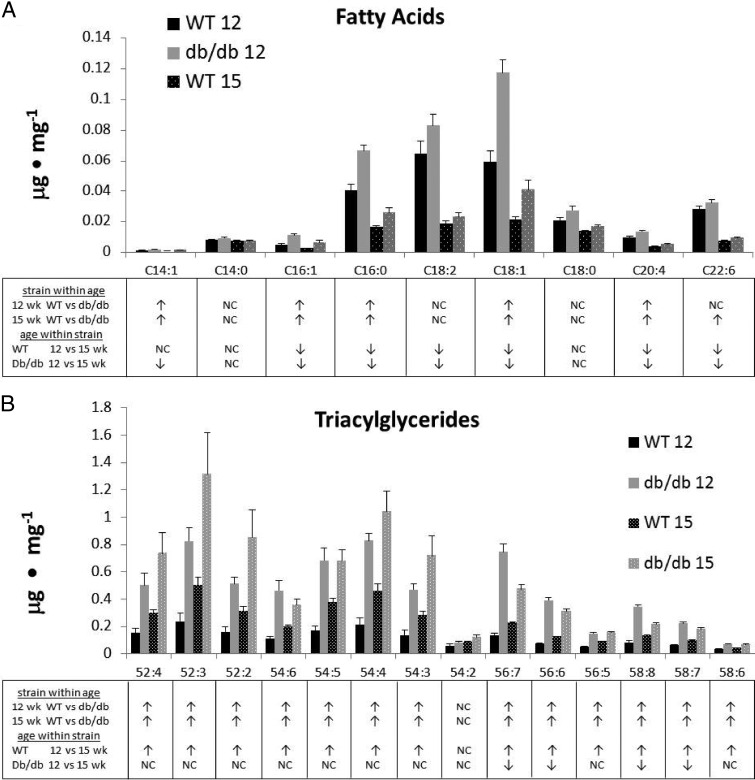
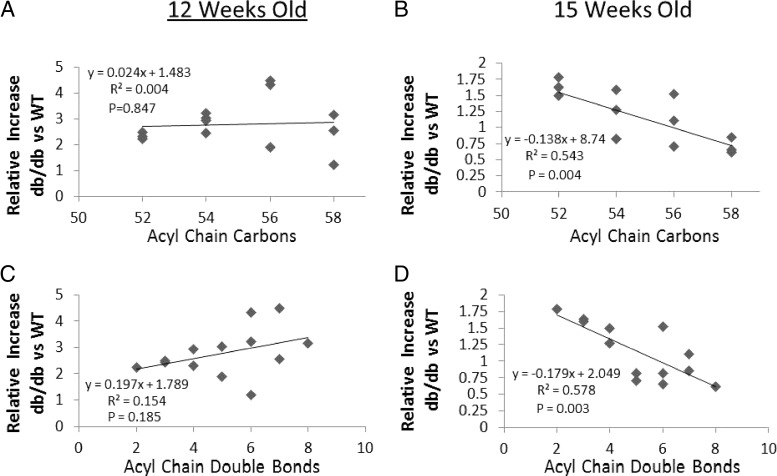
Obesity and a nondipping circadian blood pressure (BP) pattern are associated with diastolic dysfunction. Ectopic lipid accumulation is increasingly recognized as an important metabolic abnormality contributing to diastolic dysfunction. However, little is known about the contribution of different lipids and the composition of lipid analytes to diastolic dysfunction. We have performed functional and structural studies and analyzed cardiac lipid profile at two time points during progression to diastolic dysfunction in a genetic model of obesity. Serial cardiac magnetic resonance imaging and telemetric measures of BP between 12 and 15 wk of age in obese male db/db mice indicated a nondipping circadian BP pattern and normal diastolic function at 12 wk that progressed to a deteriorating nondipping pattern and onset of diastolic dysfunction at 15 wk of age. Lipidomic analysis demonstrated elevated fatty acids and ceramides in db/db at 12 wk, but their levels were decreased at 15 wk, and this was accompanied by persistent mitochondrial ultrastructural abnormalities in concert with evidence of increased fatty acid oxidation and enhanced production of reactive oxygen species. Triacylglyceride and diacylglyceride levels were elevated at both 12 and 15 wk, but their composition changed to consist of more saturated and less unsaturated fatty acyl at 15 wk. An increase in the lipid droplets was apparent at both time points, and this was associated with increases in phosphatidycholine. In conclusion, a distinct pattern of myocardial lipid remodeling, accompanied by oxidative stress, is associated with the onset of diastolic dysfunction in obese, insulin-resistant db/db mice.


Figures

Fig. 1.
Fig. 1.
A, Representative mid-ventricle short-axis cMRI images illustrate enddiastole, end-systole, and early diastole phases (frame 1 and 9–12 of 16 captured) in a cardiac cycle. The top row demonstrates delayed LV diastolic relaxation and decreased early filling rate in the 15-wk-old db/db mice compared to that of WT, shown in the bottom row. Bar graphs show the mean ± SE for the diastolic parameters, peak filling rate (B), and diastolic relaxation time (C). Statistical analysis was by two-way ANOVA and Holm-Sidak post hoc test for paired comparisons or by Student's t test (*, P < 0.05).
Fig. 2.
Fig. 2.
Radiotelemetry-derived SBP and diastolic BP (DBP) pressures, MAP, and HR of 12- to 15-wk-old WT and db/db mice recorded during the light and dark cycles. B, Line graphs show systolic, diastolic, and MAP dipping status for 12- to 15-wk-old WT and db/db mice. Each point or bar represents the mean ± SE for four WT or three db/db mice. Statistical analysis was by repeated-measures ANOVA or Student's t test (*, P < 0.05, WT vs. db/db within age).
Fig. 3.
Fig. 3.
Myocardial β-HAD and citrate synthase activities (A, B) from LV of 12- and 15-wk-old WT and db/db mice (n = 5–6/group). Oxidative and nitrosative stress are elevated in the db/db myocardium. C, Increased reactive oxygen species in the 15-wk db/db heart. D, Representative sections show 3-NTY immunostaining in the panels, and the accompanying bar graph (E) indicates increased 3-NTY levels in the db/db heart at 12 and 15 wk of age compared to age-matched WT. *, P < 0.05.
Fig. 4.
Fig. 4.
Abnormalities in sarcomere and mitochondrial ultrastructure in 12- and 15-wk-old db/db mice compared to age-matched WT mice. Transmission electron micrographs (12 wk = 1000× and 15 wk = 1500× magnification) show that LV myocardial ultrastructure of db/db hearts at both time points exhibit increased numbers of lipid droplets (white arrowheads) and increased numbers of intramyofibrillar mitochondria (white arrows) and disrupted sarcomeric structure (white S). The insets show disrupted mitochondrial cristae structure and loss of matrix in the 12-wk db/db heart compared to WT.
Fig. 5.
Fig. 5.
Total fatty acids (A), TAG (B), DAG (D), Cer (G), SM (H), PC (I), LPC (J), and PE (K) in the left ventricles of 12- and 15-wk-old WT and db/db mice were quantified by electrospray ionization-mass spectrometry. C, Protein levels of ATGL, a lipase that hydrolyzes TAG to DAG; phosphorylated-HSLser563 normalized to total HSL (HSLser563/HSL) (E); and phosphorylated-HSLser660 normalized to total HSL (HSLser660/HSL) (F). Protein levels are expressed as a percentage of WT. L, Increases in the ratio of PC/PE in the left ventricles of 12- and 15-wk-old db/db mice, compared to their WT counterparts. Each bar represents the mean ± SE for five to six WT or db/db mice. Statistical analysis was by two-way ANOVA and Holm-Sidak post hoc test for paired comparisons or Student's t test (*, P < 0.05).
Fig. 6.
Fig. 6.
A, Fatty acid and TAG (B) accumulation in the hearts of 12- and 15-wk-old db/db mice compared to age-matched WT mice. Each bar represents the mean ± SE for 5–6 WT or db/db mice. Statistical analysis was by Student's t test for each lipid subspecies and differences (P < 0.05), i.e., increase, no change (NC) or decrease, are indicated by ↑, NC, and ↓, respectively, in the table below the graph.
Fig. 7.
Fig. 7.
Myocardial TAG patterns between 12- and 15-wk-old WT and db/db mice (A–D). The content of each lipid species (μg · mg−1 tissue) in db/db mouse hearts was normalized to the corresponding lipid species in WT hearts to obtain a ratio representing the relative content of each lipid. Each data point represents the lipid ratio plotted as a function of either acyl-chain carbon number or acyl-chain double-bond number. Statistical analysis was by linear regression and data from five to six WT and db/db mice were used to generate regressions.

Similar articles

Cited by

References

    1. Santos JL, Salemi VM, Picard MH, Mady C, Coelho OR. 2011. Subclinical regional left ventricular dysfunction in obese patients with and without hypertension or hypertrophy. Obesity (Silver Spring) 19:1296–1303 - PubMed
    1. Van Putte-Katier N, Rooman RP, Haas L, Verhulst SL, Desager KN, Ramet J, Suys BE. 2008. Early cardiac abnormalities in obese children: importance of obesity per se versus associated cardiovascular risk factors. Pediatr Res 64:205–209 - PubMed
    1. Yoon YS, Uchida S, Masuo O, Cejna M, Park JS, Gwon HC, Kirchmair R, Bahlman F, Walter D, Curry C, Hanley A, Isner JM, Losordo DW. 2005. Progressive attenuation of myocardial vascular endothelial growth factor expression is a seminal event in diabetic cardiomyopathy: restoration of microvascular homeostasis and recovery of cardiac function in diabetic cardiomyopathy after replenishment of local vascular endothelial growth factor. Circulation 111:2073–2085 - PubMed
    1. Kannel WB, Wilson PW, Zhang TJ. 1991. The epidemiology of impaired glucose tolerance and hypertension. Am Heart J 121:1268–1273 - PubMed
    1. Lurbe E, Torro I, Aguilar F, Alvarez J, Alcon J, Pascual JM, Redon J. 2008. Added impact of obesity and insulin resistance in nocturnal blood pressure elevation in children and adolescents. Hypertension 51:635–641 - PubMed

Publication types