. 2012 Dec;18(12):1820-6.
doi: 10.1038/nm.2972. Epub 2012 Nov 11.

A live, impaired-fidelity coronavirus vaccine protects in an aged, immunocompromised mouse model of lethal disease

Affiliations

A live, impaired-fidelity coronavirus vaccine protects in an aged, immunocompromised mouse model of lethal disease

Rachel L Graham et al. Nat Med. 2012 Dec.

Abstract

Live, attenuated RNA virus vaccines are efficacious but subject to reversion to virulence. Among RNA viruses, replication fidelity is recognized as a key determinant of virulence and escape from antiviral therapy; increased fidelity is attenuating for some viruses. Coronavirus (CoV) replication fidelity is approximately 20-fold greater than that of other RNA viruses and is mediated by a 3'→5' exonuclease (ExoN) activity that probably functions in RNA proofreading. In this study we demonstrate that engineered inactivation of severe acute respiratory syndrome (SARS)-CoV ExoN activity results in a stable mutator phenotype with profoundly decreased fidelity in vivo and attenuation of pathogenesis in young, aged and immunocompromised mice. The ExoN inactivation genotype and mutator phenotype are stable and do not revert to virulence, even after serial passage or long-term persistent infection in vivo. ExoN inactivation has potential for broad applications in the stable attenuation of CoVs and, perhaps, other RNA viruses.


Conflict of interest statement

The authors declare no competing financial interests.

Figures
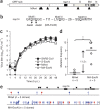
Figure 1
Figure 1. The nsp14 ExoN mutator virus in a virulent mouse-adapted SARS-CoV isogenic background.
(a) Genome organization, with the locations of the nsp14 coding sequence (black rectangle) and the mouse-adapted mutations (triangles) shown. ORF1a/b, ORF1a and ORF1b. Structural proteins are labeled as follows: S, spike; E, envelope; M, membrane; N, nucleocapsid. (b) Nsp14 ExoN motifs, DEDD domain residues (underlined) and alanine substitutions (D90A and E92A) in motif I recovered in wild-type SARS-CoV and MAwt backgrounds. (c) Growth analysis (MOI = 0.1 PFU per cell) of wild-type SARS-CoV, S-ExoN, MAwt and MA-ExoN on Vero cells. Error bars, s.d. (d) Mutation frequency from complete genome sequencing of plaque isolates of MAwt and MA-ExoN (n = 5 for both) at passage 3. The increase in mean mutation frequency (horizontal lines) in MA-ExoN compared to MAwt (11.5×) is indicated. *P < 0.01 (Mann-Whitney nonparametric test for independent samples). (e) The mutations identified with complete genome sequencing across five clones from each group. Filled circles, nonsynonymous mutations; open circles, synonymous mutations; black, noncoding mutations; red, mutations present in more than one clone; blue, mutations present in only one clone. Mouse-adapted mutations are shown as triangles on the genome schematic and were present in all sequenced genomes.
Figure 2
Figure 2. Weight loss and lung titer in BALB/c mice.
(ae) MA-ExoN and MAwt infections of 10-week-old (a,b) and 12- to 14-month-old (ce) female BALB/c mice. (a,c) Weight loss. Dark shapes and solid lines, MA-ExoN; white shapes and dashed lines, MAwt; diamonds, 102 PFU; squares, 103 PFU; triangles, 104 PFU. Error bars indicate s.d. (b,d) Lung titers. The titer for each mouse lung is indicated by an open circle; the mean titer of all mice at each time point is indicated by a horizontal bar. Days p.i. are indicated on the x axes; 2log, 3log and 4log indicate the MOIs of each virus (102, 103 or 104 PFU, respectively). (e) Survival within aged mouse groups, calculated as the percentage of surviving mice compared to the total number of mice remaining on each day of the experiment. Line weights and symbols are as in a and c.
Figure 3
Figure 3. Weight loss and lung titer in young immunocompromised mice.
(ac) MA-ExoN and MAwt infections of 10-week-old Rag−/− (a), SCID (b) and Stat1−/− (c) mice. C57BL/6 (a), BALB/c (b) and 129 (c) mice were included as background controls. Weight loss is shown. Dark shapes and solid lines, immunocompromised mice; white shapes and dashed lines, background control mice; circles, MA-ExoN; squares, MAwt. Error bars indicate s.d. (df) Lung titers for Rag−/− (d), SCID (e) and Stat1−/− (f) mice and background controls. The titer of each mouse lung is indicated by an open circle; the mean of all titers at each time point is indicated by a horizontal bar. Days p.i. are indicated on the x axes.
Figure 4
Figure 4. Mutation accumulation in infected SCID mice at 30 d.p.i.
The SARS-CoV genome is depicted at the top. The nsp14 ExoN coding region is denoted by a purple box, with the inactivating amino acid changes indicated above the schematic. The receptor-binding domain (RBD) is denoted by a black box. Individual SCID mouse genome sequences are represented by black horizontal lines. Dashed lines separate the nonstructural protein sequences in ORF1 and downstream ORFs. Mutations are indicated by lollipop shapes colored as follows: blue, synonymous, unique to one sequence; light blue, synonymous, present in three sequences; red, nonsynonymous, unique to one sequence; green, synonymous, present in two sequences; purple, nsp14 ExoN inactivation mutations. Mutations that alter the size of an ORF are indicated by a red Δ (deletion) or a red S (stop codon). Genome sizes, ORF and nonstructural protein boundaries and mutation marker placements are approximate.
Figure 5
Figure 5. Virulence of passaged MA-ExoN and MAwt viruses.
(ac) MA-ExoN and MAwt serial infections of 12-month-old female BALB/c mice. Passages (P) are indicated on the x axes. (a) Serial passage after 24 h. (b,c) Serial passage after 72 h. (a,b) Lung titers are shown, with average titers indicated by bars. In the 72-h passage, MAwt-infected mice died by day 3 of passage 2; thus, the viruses were not passaged further. (c) Weight loss in the mice infected in the 72-h passage is shown. Error bars indicate s.d. (d) MA-ExoN (24-h passage 8 and 72-h passage 3) and MAwt (passage 1) infections of 12-month-old female BALB/c mice. Weight loss is shown. Error bars indicate s.d. (e) Infections of 10-week-old female BALB/c mice with MA-ExoN and MAwt population viruses isolated from SCID mice at 30 d p.i.; weight loss is shown. Dashed line, mock (PBS) inoculation; dark shapes and solid lines, MA-ExoN; white shapes and solid lines, MAwt. For each virus, lungs from three separate mice were harvested (mouse 1–mouse 3), and viruses were subsequently inoculated without plaque purification (population); circles, mouse 1 populations (pop 1); squares, mouse 2 populations (pop 2); triangles, mouse 3 populations (pop 3). (f) Weight loss in 11-month-old female BALB/c mice infected with MA-ExoN 2.1 (with C16999A) or MA-ExoN 3.1 (without C16999A) plaque isolates from SCID mice after 30 d of infection (SCID30). Squares, SCID30 MA-ExoN 2.1; circles, SCID30 MA-ExoN 3.1. Error bars indicate s.d.
Figure 6
Figure 6. MA-ExoN vaccination protects from lethal challenge.
(a,b) Low-passage MA-ExoN and mock (PBS) vaccinations of 12-month-old female BALB/c mice followed by lethal challenge with MAwt. (a) Weight loss in challenged mice. Dark circles, 104 PFU MA-ExoN vaccination; white circles, 102.5 PFU MA-ExoN vaccination; dark triangles, PBS vaccination. Error bars indicate s.d. (b) Lung titers at day 2 after challenge. ExoN was given at a 2.5log (102.5 PFU) vaccination. The mean titer is indicated by a bar in each group. (c) Fifty-percent plaque reduction neutralization titer (PRNT50) assay using sera from PBS-vaccinated and MA-ExoN–vaccinated mice to neutralize MAwt. Reciprocal dilutions capable of effecting 50% plaque reduction are shown by circles; mean reciprocal dilutions are indicated by a bar for each group. The limit of detection for each assay, if given, is indicated by a dashed line.

References

    1. Jones KE, et al. Global trends in emerging infectious diseases. Nature. 2008;451:990–993. doi: 10.1038/nature06536. - DOI - PMC - PubMed
    1. Li Y, et al. On the origin of smallpox: correlating variola phylogenics with historical smallpox records. Proc. Natl. Acad. Sci. USA. 2007;104:15787–15792. doi: 10.1073/pnas.0609268104. - DOI - PMC - PubMed
    1. Morens DM, Fauci AS. The 1918 influenza pandemic: insights for the 21st century. J. Infect. Dis. 2007;195:1018–1028. doi: 10.1086/511989. - DOI - PubMed
    1. Sessa R, Palagiano C, Scifoni MG, di Pietro M, Del Piano M. The major epidemic infections: a gift from the Old World to the New? Panminerva Med. 1999;41:78–84. - PubMed
    1. Cheng VC, Lau SK, Woo PC, Yuen KY. Severe acute respiratory syndrome coronavirus as an agent of emerging and reemerging infection. Clin. Microbiol. Rev. 2007;20:660–694. doi: 10.1128/CMR.00023-07. - DOI - PMC - PubMed

Publication types

MeSH terms

Associated data