. 2012 Dec;11(12):1065-73.
doi: 10.1038/nmat3468. Epub 2012 Nov 11.

Ultrasmall implantable composite microelectrodes with bioactive surfaces for chronic neural interfaces

Affiliations

Ultrasmall implantable composite microelectrodes with bioactive surfaces for chronic neural interfaces

Takashi D Yoshida Kozai et al. Nat Mater. 2012 Dec.

Abstract

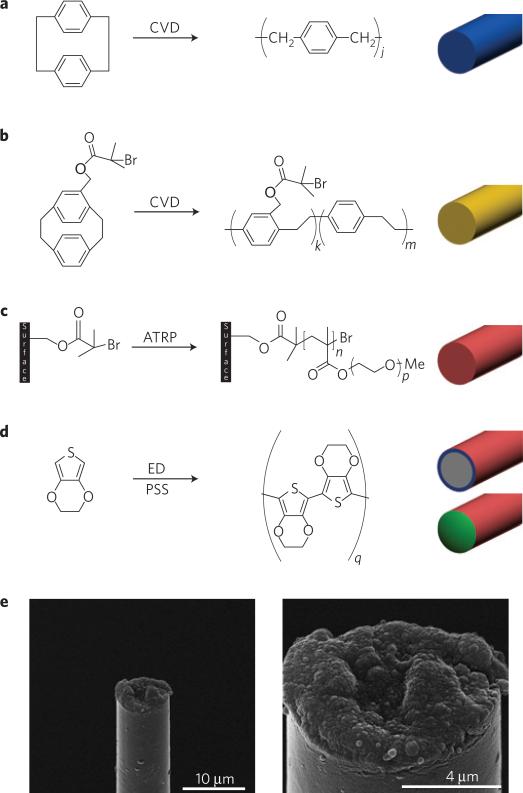
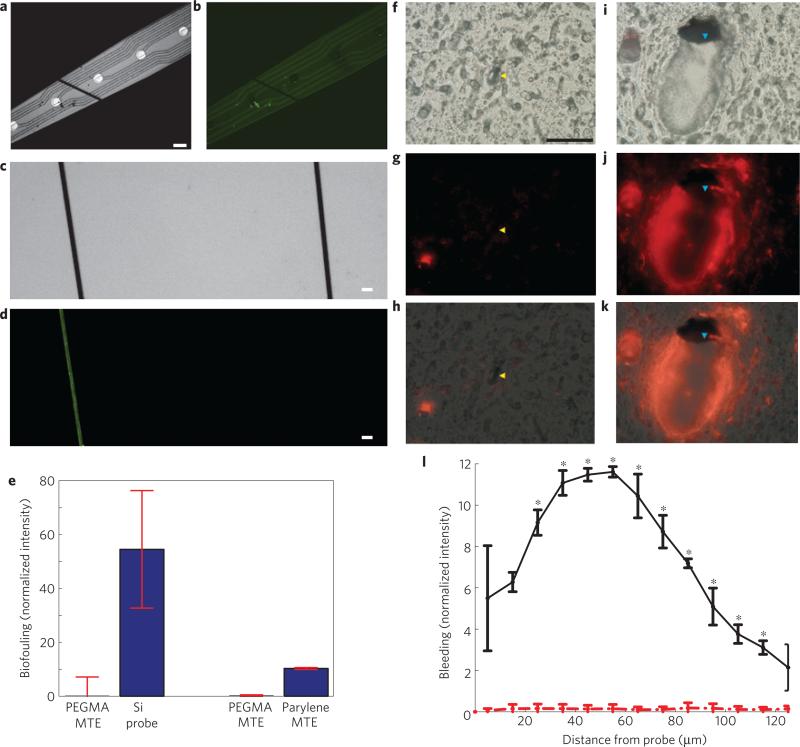
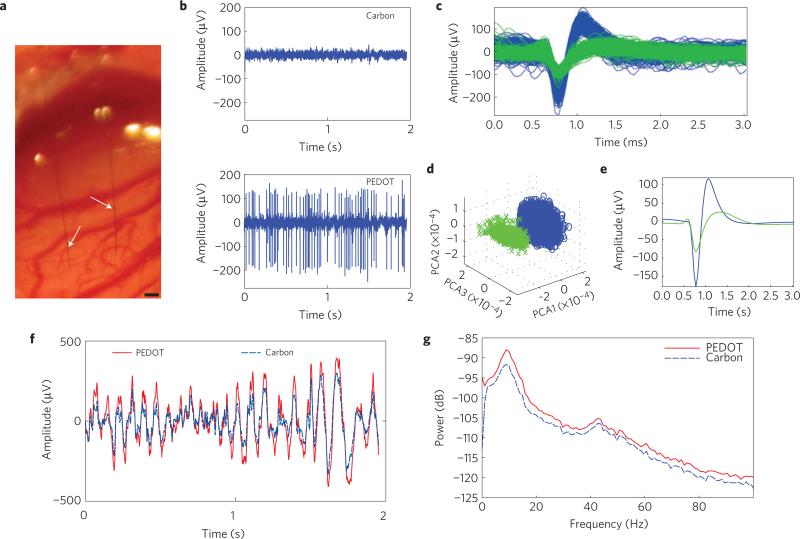
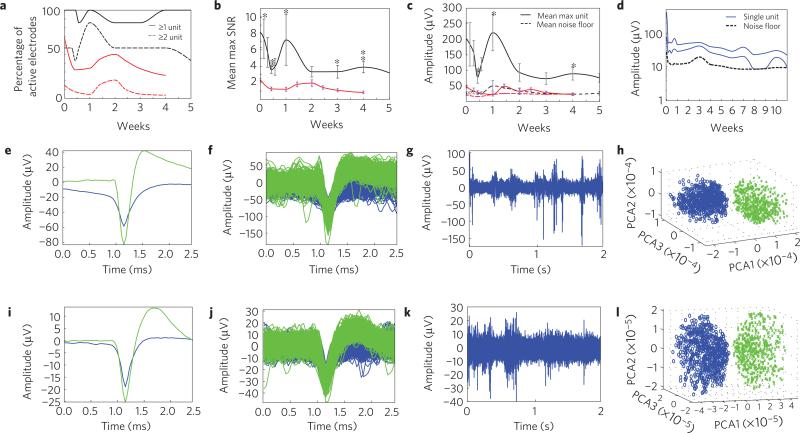
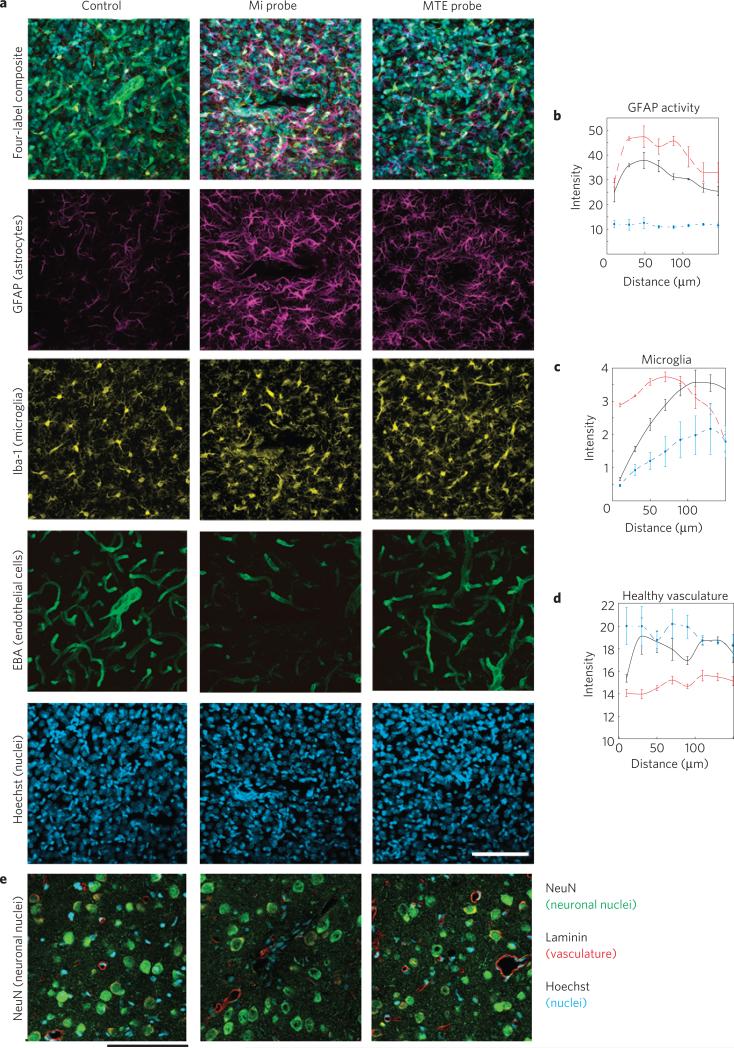
Implantable neural microelectrodes that can record extracellular biopotentials from small, targeted groups of neurons are critical for neuroscience research and emerging clinical applications including brain-controlled prosthetic devices. The crucial material-dependent problem is developing microelectrodes that record neural activity from the same neurons for years with high fidelity and reliability. Here, we report the development of an integrated composite electrode consisting of a carbon-fibre core, a poly(p-xylylene)-based thin-film coating that acts as a dielectric barrier and that is functionalized to control intrinsic biological processes, and a poly(thiophene)-based recording pad. The resulting implants are an order of magnitude smaller than traditional recording electrodes, and more mechanically compliant with brain tissue. They were found to elicit much reduced chronic reactive tissue responses and enabled single-neuron recording in acute and early chronic experiments in rats. This technology, taking advantage of new composites, makes possible highly selective and stealthy neural interface devices towards realizing long-lasting implants.


Figures

Figure 1
Figure 1. Microthread electrodes
a–d, Preparation of a MTE: carbon fibres are coated with 800 nm poly(p-xylylene) (a); the fibre is further coated with a 50-nm-thick layer of poly((p-xylylene-4-methyl-2-bromoisobutyrate)-co-(p-xylylene)) (b); poly(ethylene glycol) is covalently grafted onto the doubly coated fibre by ATRP (c); a carbon recording site is exposed at the tip by cutting away the insulation, and the recording site is coated with PEDOT by electrochemical deposition (ED; d). e, SEM images of a fully assembled, functional MTE.
Figure 2
Figure 2. In vitro electrical characterization of MTEs
a,b, Electrical characterization of a poly(p-xylylene)-coated carbon fibre, a poly(p-xylylene)-coated fibre with an exposed carbon tip and a poly(p-xylylene)-coated fibre with a recording site of PEDOT:PSS electrodeposited with applied charges of 5, 25, 50, 100, 200 and 400 nC. a, Bode magnitude impedance plot showing decreasing impedance with increasing PEDOT deposition across all frequencies. b, Bode phase plot showing phase shift towards smaller phases indicative of a change from a capacitive carbon interface to a faradaic PEDOT interface with increasing deposition. The poly(p-xylylene)-insulated fibre without an exposed recording site was not plotted because a reliable signal could not be detected. c, Cyclic voltammogram showing increasing charge storage capacity with increasing PEDOT deposition in response to voltage cycling of the electrode site.
Figure 3
Figure 3. Physical characteristics of the MTEs
a, A MTE laid on top of a 10 mm silicon electrode. Scale bar, 50 μm. b, FITC–albumin adsorbed onto a 10 mm silicon electrode whereas an ATRP-PEGMA surface-coated MTE showed no adsorption. c, Bright-field images of FITC–albumin adsorbed onto a poly(p-xylylene)-coated device (left) and an ATRP-PEGMA coated device (right). Scale bar, 20 μm. d, The same image as in c under fluorescent microscopy showing less protein adsorption onto the PEGMA surface (right) compared with the poly(p-xylylene) surface (left). e, Comparison of the intensity of adsorbed FITC–albumin between PEGMA-coated MTEs and silicon probes (left), and PEGMA coated MTEs and poly(p-xylylene)-coated MTEs. Error bars show s.d. f–k, Comparison of acute BBB disruption caused by MTE probes (yellow arrowhead; f–h) and silicon probes (blue arrowhead; i–k) during insertion into the rat cortex. f, Differential interference contrast image of a rat motor cortex section around a MTE footprint. Scale bar, 100 μm. g, A BBB impermeable fluorescent dye was used to image the vasculature and bleeding around the MTE. h, Overlay of images in f,g. i, Differential interference contrast image of a 5 mm silicon probe in the same section. j, Bleeding around the silicon probe. k, Overlay of images in i,j. l ,Radial intensity profile indicating bleeding around silicon electrodes (solid black) and MTEs (dashed red). Error bars show s.e.m.; indicates statistical significance, p < 0.05.
Figure 4
Figure 4. In vivo single-unit recording capabilities
a, MTA stereotrode (arrows) implanted 1.6 mm deep into the cortex. Scale bar, 100 μm. b, Representative example of 2 s of high-speed recordings taken simultaneously on the same array. Recordings on the carbon site channel show no discernible single units with a noise floor of 16.6 μV (top), whereas recordings taken on the channel with the PEDOT:PSS site show SNRs of 12.7 and 4.71 and a noise floor of 23.4 μV (bottom). c, Piled single-unit neural recordings over 3 min from a poly(p-xylylene)-coated PEDOT:PSS device. d, Results from PCA showing two distinct clusters. e, Mean waveform for each unit spike. f, Raw LFP simultaneously recorded across both channels. The PEDOT:PSS site channel recorded a noise floor of 332 μV (solid red), whereas the carbon site channel recorded a noise floor of 233 μV (dashed blue). g, Power density spectra across the LFP range showing that for the LFP range both recording materials are similar.
Figure 5
Figure 5. Chronic in vivo recording capabilities of MTEs
a, Percentage of active chronically implanted MTEs (black, N = 7) and silicon probes (red, N = 80 sites, 5 probes) able to detect at least 1 single unit (solid line) or at least 2 single units (dashed line) as a function of weeks post-implantation. b, Mean SNR of the largest single unit detected on each electrode for MTE (black, N = 7) and silicon probes (red, N = 80). Error bars indicate s.e.m.;* and ** indicate two-tailed, unequal variance statistical significance, p < 0.05 and p < 0.01, respectively. c, Mean amplitude of the largest single unit detected on each electrode (solid line), and the mean noise floor of each electrode (dashed line) for MTEs (black, N = 7) and silicon electrodes (red, N = 80). Error bars indicate s.e.m.; * indicates two-tailed, unequal variance statistical significance, p < 0.05. d, Amplitude of two distinct single units detected on the same electrode from the longest implant (solid, blue) starting at 408 μV on day 0. Amplitude of the noise floor from the same animal (dashed, black). For the purpose of this figure, when only one single unit was detected, the second amplitude was considered to be the same as the noise floor. e–h, Electrophysiological recordings taken from a rat with a MTE implanted in M1 five weeks post-implantation. i–l, Electrophysiological recordings taken from a different rat implanted with a MTE in M1 seven weeks post-implantation. e,i, Mean waveform of discernible single units. f,j, Piled single units from 2 min of recordings. g,k, Representative example of 2 s of high-speed recordings. h,l, Results from PCA showing distinct clusters.
Figure 6
Figure 6. Histological comparison of tissue reaction to chronically implanted microthread and silicon probes
a, Tissue responses in motor cortex following a two-week implantation of a planar silicon electrode (centre), MTE (right) and a negative control from the contralateral hemisphere (left). Tissues are labelled for astrocytes (purple), microglia (yellow), BBB/endothelial cells (green) and nuclei (blue). Scale bar, 100 μm. b–d, Fluorescent intensity profile with increasing distance from the probe surface for MTE (solid black), silicon probe (dashed red) and control tissue (dash–dot blue). Error bars show s.e.m. b, Astrocyte GFAP activity. c, Microglia IBA-1 intensity. d, Healthy endothelial cells. e, Neurons (green), vasclature (red) and cell nuclei (blue) of a planar silicon electrode (centre), MTE (right) and a negative control from the contralateral hemisphere (left) from a separate tissue sample. Scale bar, 100 μm.

References

    1. Strumwasser F. Long-term recording’ from single neurons in brain of unrestrained mammals. Science. 1958;127:469–470. - PubMed
    1. Kipke DR, et al. Advanced neurotechnologies for chronic neural interfaces: New horizons and clinical opportunities. J. Neurosci. 2008;28:11830–11838. - PMC - PubMed
    1. Schmidt EM, Bak MJ, McIntosh JS. Long-term chronic recording from cortical neurons. Exp. Neurol. 1976;52:496–506. - PubMed
    1. Grill WM, Norman SE, Bellamkonda RV. Implanted neural interfaces: Biochallenges and engineered solutions. Annu. Rev. Biomed. Eng. 2009;11:1–24. - PubMed
    1. Biran R, Martin DC, Tresco PA. Neuronal cell loss accompanies the brain tissue response to chronically implanted silicon microelectrode arrays. Exp. Neurol. 2005;195:115–126. - PubMed

Publication types