. 2012 Dec;9(12):1202-5.
doi: 10.1038/nmeth.2249. Epub 2012 Nov 11.

Two-photon optogenetics of dendritic spines and neural circuits

Affiliations

Two-photon optogenetics of dendritic spines and neural circuits

Adam M Packer et al. Nat Methods. 2012 Dec.

Abstract

We demonstrate a two-photon optogenetic method that generates action potentials in neurons with single-cell precision, using the red-shifted opsin C1V1(T). We applied the method to optically map synaptic circuits in mouse neocortical brain slices and to activate small dendritic regions and individual spines. Using a spatial light modulator, we split the laser beam onto several neurons and performed simultaneous optogenetic activation of selected neurons in three dimensions.


Figures
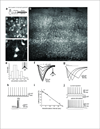
Figure 1
Figure 1. Two-photon activation of individual neurons with C1V1T in mouse brain slices
(a) Experimental strategy. AAVs encoding for the opsin C1V1T and EYFP- genes are injected into the somatosensory cortex of a mouse. Several weeks later, brain slices are made from the infected region. (b) Two-photon fluorescence image of a living cortical brain slice expressing EYFP (940 nm excitation, 15 mW on sample, 25× 1.05 NA objective, scale 100 µm). (c, d) Higher magnification images from (b) showing C1V1T-expressing cells in upper and lower layers (Scales c: 20 and d: 10 µm). (e) Distribution of steady-state currents, elicited by one-photon widefield stimulation, measured with voltage clamp recordings from C1V1T-expressing cells (Hg arc lamp, bandpass 470–490 nm, 20× 0.5NA objective, 300 µW/mm2, 150 msec illumination time). Gray box illustrates stimulated area. (f) Two-photon photocurrents measured with voltage clamp in a C1V1T-expressing neuron under different illumination light-powers. Raster scan pattern (inset, gray lines) across a neuronal cell body had 32 lines, 2ms/line, and bidirectional scanning (1064 nm, 1–40 mW on sample, 20× 0.5NA objective). (g) Two-photon photocurrents induced in C1V1T-expressing neurons under different scan duration times (gray lines correspond to 0.5, 1, 2 and 4 ms/line; same experimental parameters as f). (h): Top: current clamp recordings from C1V1T-expressing neurons during two-photon illumination (tick marks; same experimental parameters as f). Note reliable generation of action potentials (APs). Bottom: Overlay of APs generated by two-photon illumination (grey bar).(i). Quantification of AP latency changes from similar experiments as (h) with different stimulation intervals. (j) Spiking patterns resulting from current injection at four times rheobase (top) and optical stimulation produced by continually raster scanning the cell body for the same time (bottom; otherwise same experimental parameters as f).
Figure 2
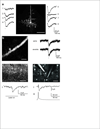
Figure 2. Two-photon stimulation of individual dendrites and spines and optical mapping of connected neurons
(a) Photostimulation of cellular processes. Center: two-photon fluorescence image of a C1V1T-expressing neuron (940 nm, 15 mW on sample, 20× 0.5 NA objective). The cell was patched and different regions of its dendritic and axonal arbor were scanned with a two-photon laser (numbered boxes), while somatic currents were simultaneously measured (left and right traces). Photostimulation parameters: 1064 nm, 30 mW on sample, 20× 0.5NA, 32×32 ROI and 2 msec/line. Scale 100 µm. (b) Similar experiment as (a), but scanning a spine head and dendritic shaft from a highly expressing neuron (left, scale 3 µm). Imaging parameters as in (a). Right: whole-cell measurements of somatic currents during scanning (gray bar; averages of 12). Photostimulation parameters: 1064 nm, 30 mW on sample, 20× 0.5NA and 30 msec point stimulation. (c) Mapping presynaptic connections. Top: two-photon fluorescence image of field of neurons expressing C1V1T (940 nm, 15 mW on sample, 20× 0.5 NA objective). Neuron “i” was patched and surrounding fluorescent neurons were photostimulated, while ESPCs in neuron “i” were monitored. . Scale, 100 µm. Photostimulation parameters: 1064 nm, 30 mW on sample, 20× 0.5NA, 32×32 ROI and 2 msec/line. Bottom: EPSCs in neuron i during photostimulation of neuron ii (average of 12). (d) Same experiment as (c), after dual whole-cell recording was established from neuron ii. Top: Two-photon fluorescence image from both neurons with identical imaging parameters as (c). (Scale, 50 µm). Bottom: Simultaneous voltage-clamp recording from neuron i and current-clamp recordings form neuron ii. .
Figure 3
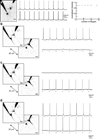
Figure 3. Two-photon 3D stimulation of two individual neurons with SLMs
(a) Left: Two-photon fluorescent image of two C1V1T-expressing neurons located in the same focal plane, which were patched. Imaging parameters: 940 nm, 15 mW on sample, 20× 0.5 NA objective. Image look-up table is inverted for clarity. An SLM phase mask was calculated to generate one photostimulation laser spot for each cell, and both laser spots were then raster-scanned simultaneously across the cell bodies (Boxes). Photostimulation parameters: 1064 nm, 30 mW per target, ROI 32×32, 2 msec/line. Middle: Whole-cell current clamp recordings from both cells during two-photon SLM photostimulation (black marks). Right: Light intensity generated by different number of SLM targets in similar experiments (see Supplementary Fig. 9 for details; 3–15 measurements per target; error bars are SD). (b) Depth selectivity of SLM photostimulation. Left: Two-photon fluorescent image of two C1V1T-expressing neurons, located 20 µm apart in depth, which were patched. A single-beam SLM stimulation spot was scanned (box). Imaging parameters as in (a). Right: whole-cell current clamp recordings from both neurons during photostimulation of one of them (black marks; black box in left) with the SLM spot. Photostimulation parameters: 1064 nm, 30 mW in one target, ROI 32×32, 2 msec/line. (c) Same experiment as in (b) but now using a two-dimensional two-beam SLM pattern. Left: Two-photon fluorescent image of two neurons. Imaging as in (a). A new SLM pattern is scanned in the superficial focal plane in the position corresponding to the two cells (boxes). Right: simultaneous dual whole cell recordings during photostimulation (black marks). Photostimulation parameters: 1064 nm, 30 mW per target, ROI 32×32, 2 msec/line. This generates (d) Same experiment as in (c) but with a three-dimensional SLM pattern, which directed two laser beam spots onto both cells simultaneously. Left: Two-photon fluorescent image of both neurons illustrating the simultaneous, multifocal SLM stimulation (boxes). Same imaging parameters as in (c). Right: simultaneous dual whole-cell recordings during photostimulation (black marks). Same photostimulation SLM parameters as in (c). .

References

    1. Yizhar O, Fenno LE, Davidson TJ, Mogri M, Deisseroth K. Neuron. 2011;71:9–34. - PubMed
    1. Katzel D, Zemelman BV, Buetfering C, Wolfel M, Miesenbock G. Nat Neurosci. 2011;14:100–107. - PMC - PubMed
    1. Nikolenko V, Poskanzer KE, Yuste R. Nat Methods. 2007;4:943–950. - PubMed
    1. Rickgauer JP, Tank DW. Proceedings of the National Academy of Sciences of the United States of America. 2009;106:15025–15030. - PMC - PubMed
    1. Andrasfalvy BK, Zemelman BV, Tang J, Vaziri A. Proceedings of the National Academy of Sciences of the United States of America. 2010;107:11981–11986. - PMC - PubMed

Publication types