

A rapid method for direct detection of metabolic conversion and magnetization exchange with application to hyperpolarized substrates
- PMID: 23143011
- PMCID: PMC3531583
- DOI: 10.1016/j.jmr.2012.09.014
A rapid method for direct detection of metabolic conversion and magnetization exchange with application to hyperpolarized substrates
Abstract
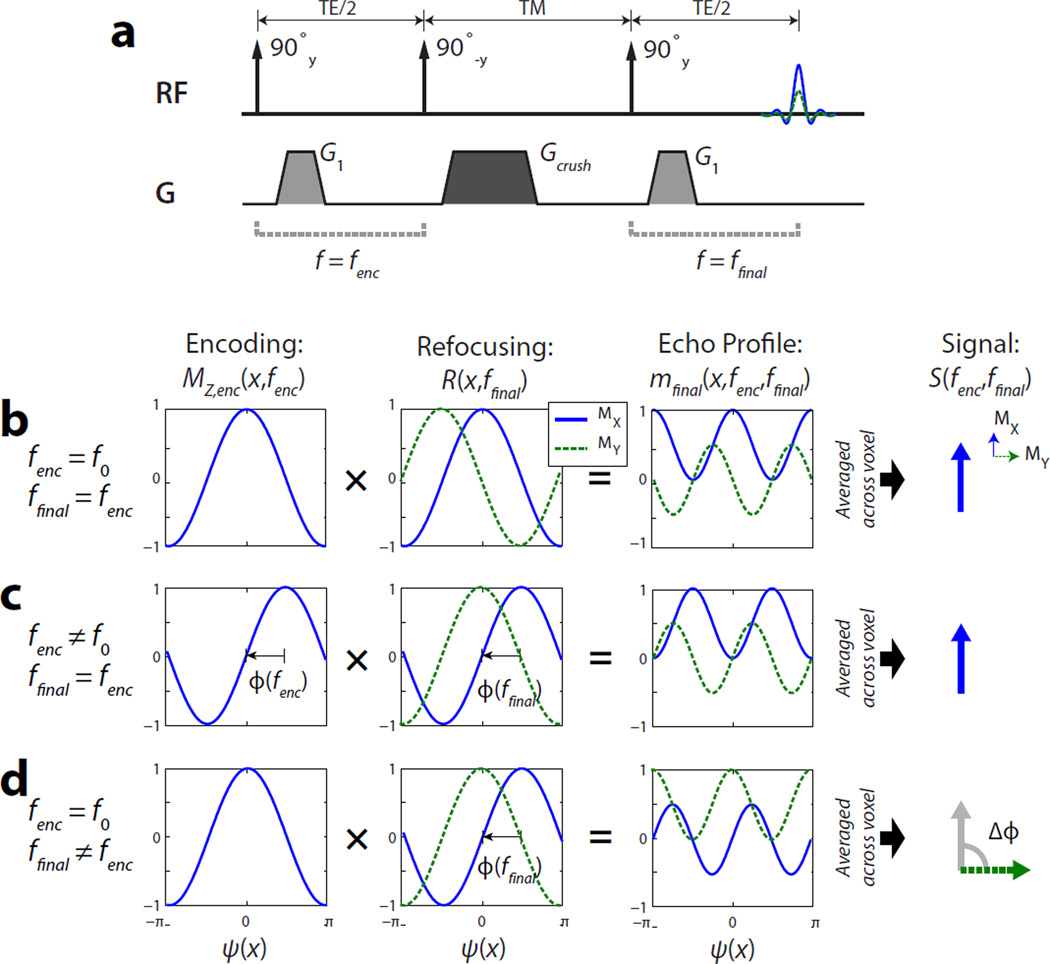
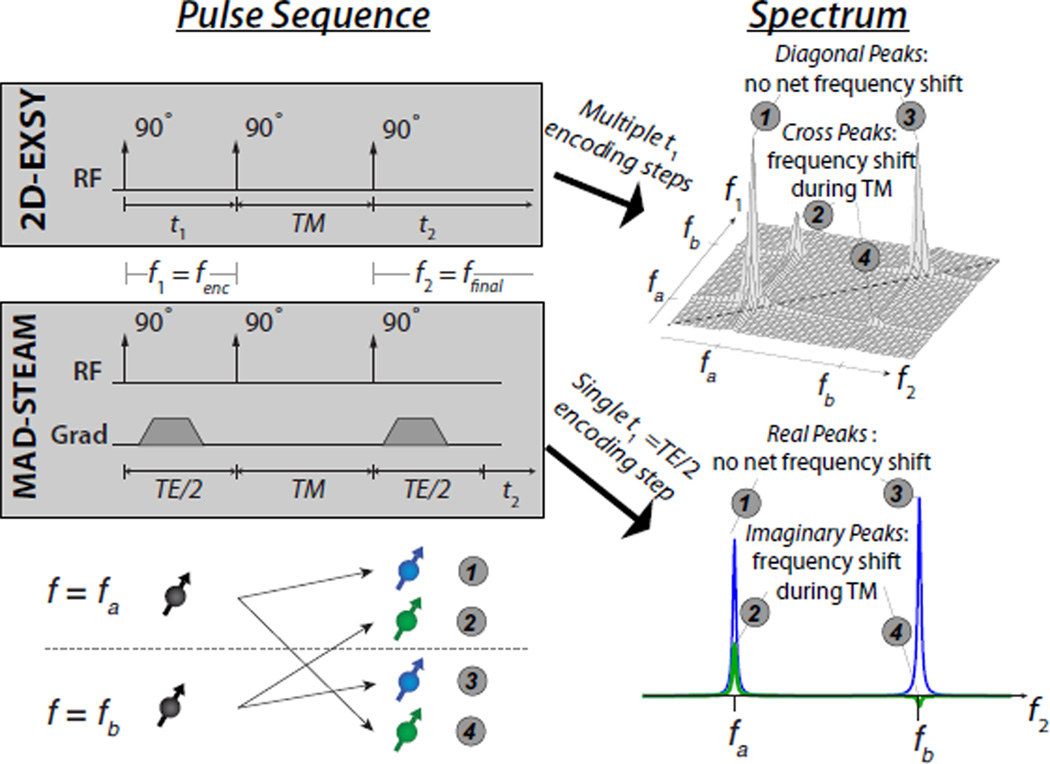
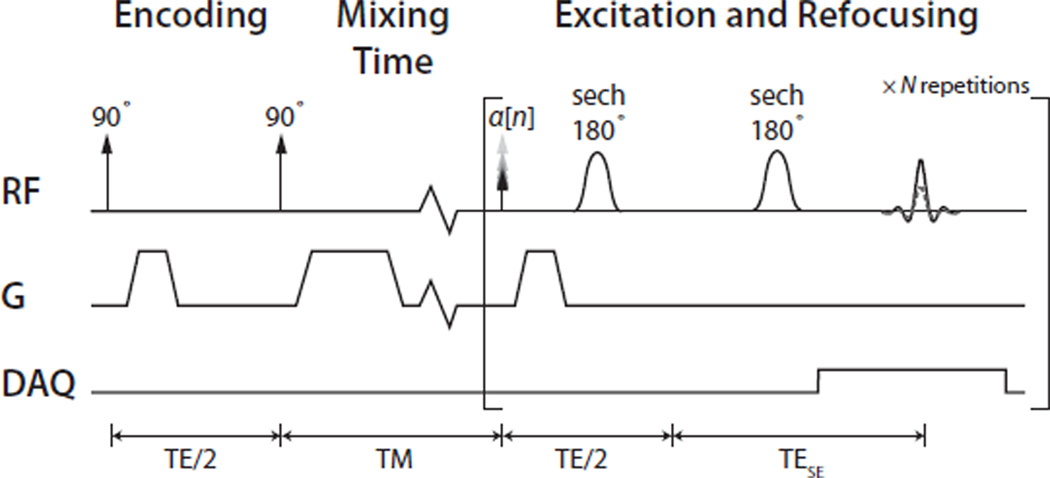
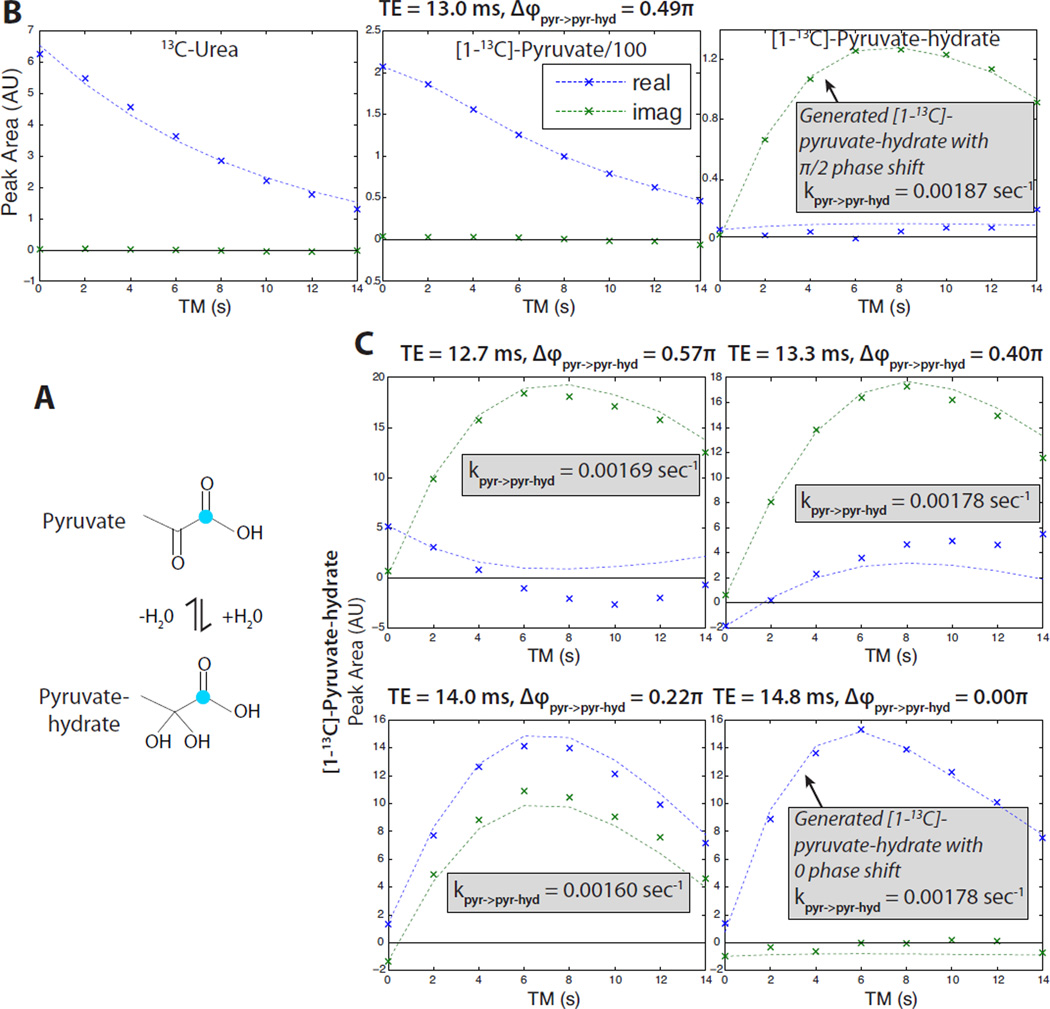
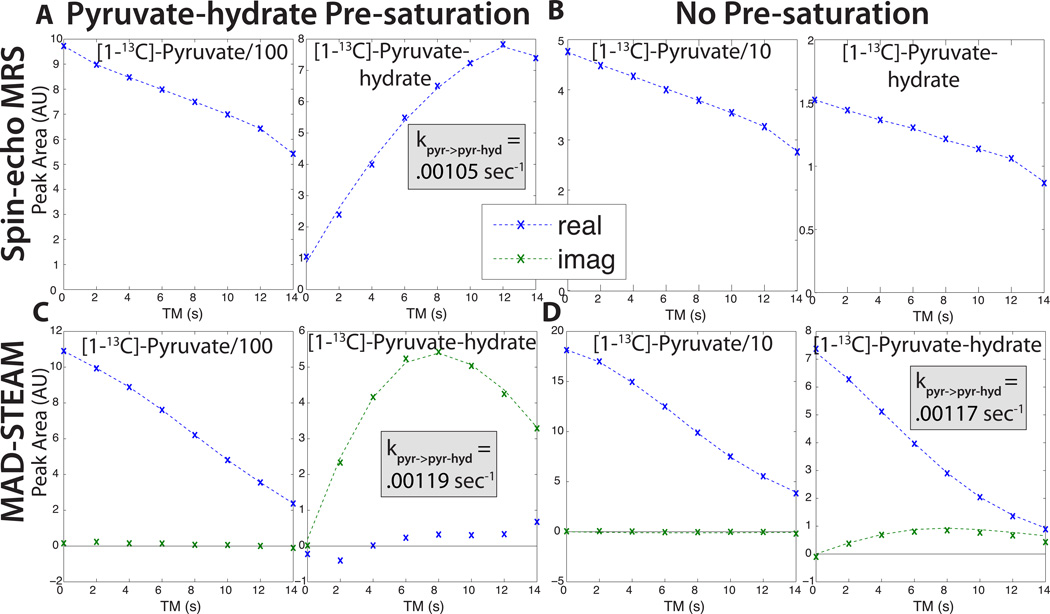
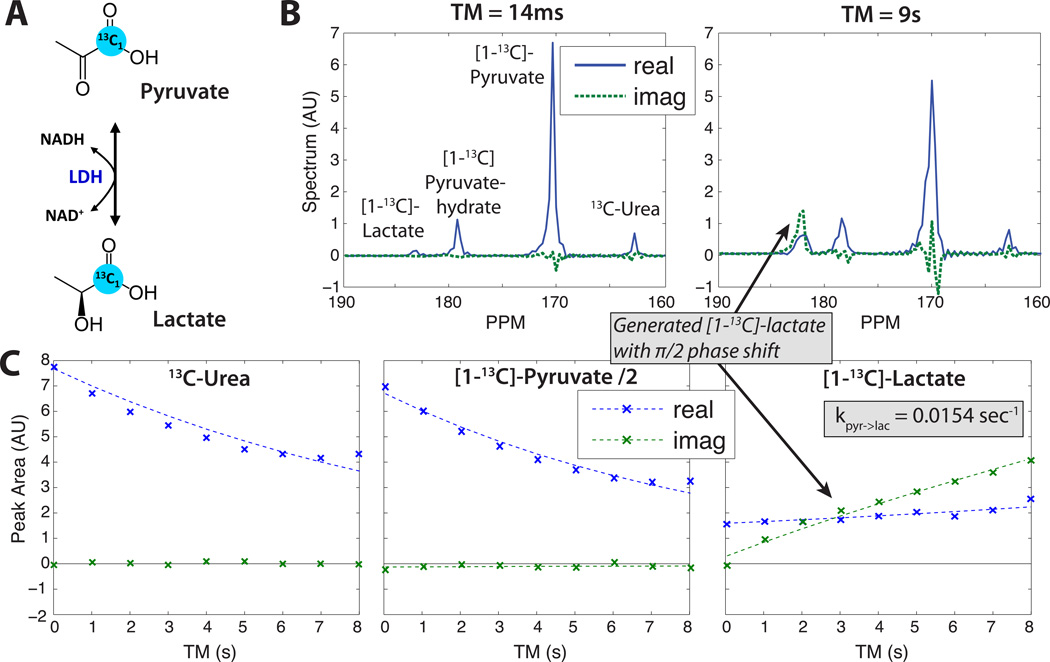
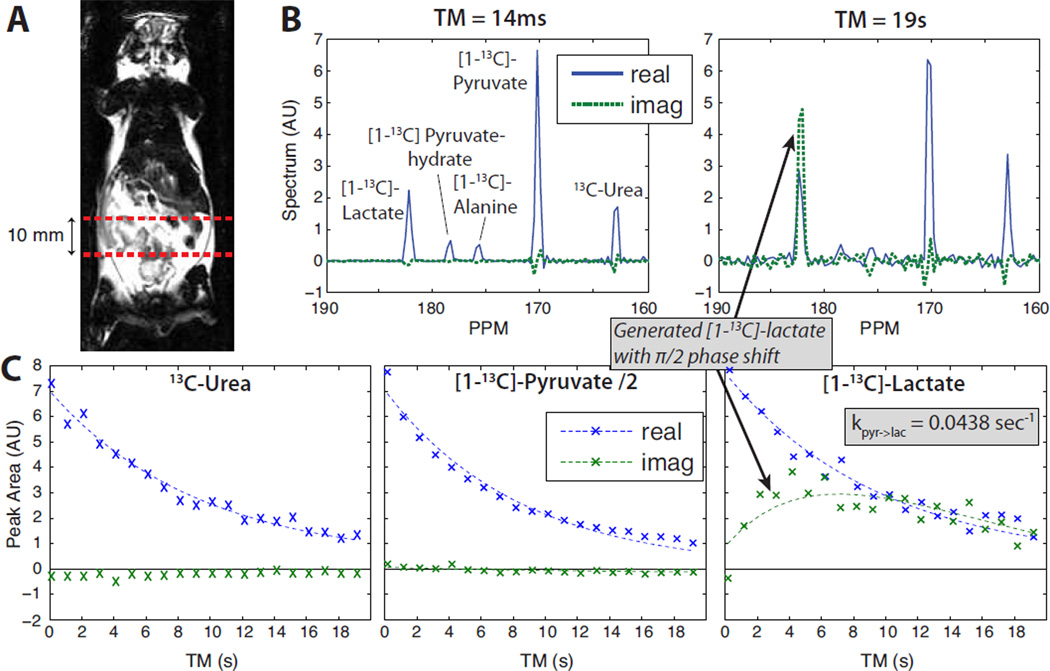
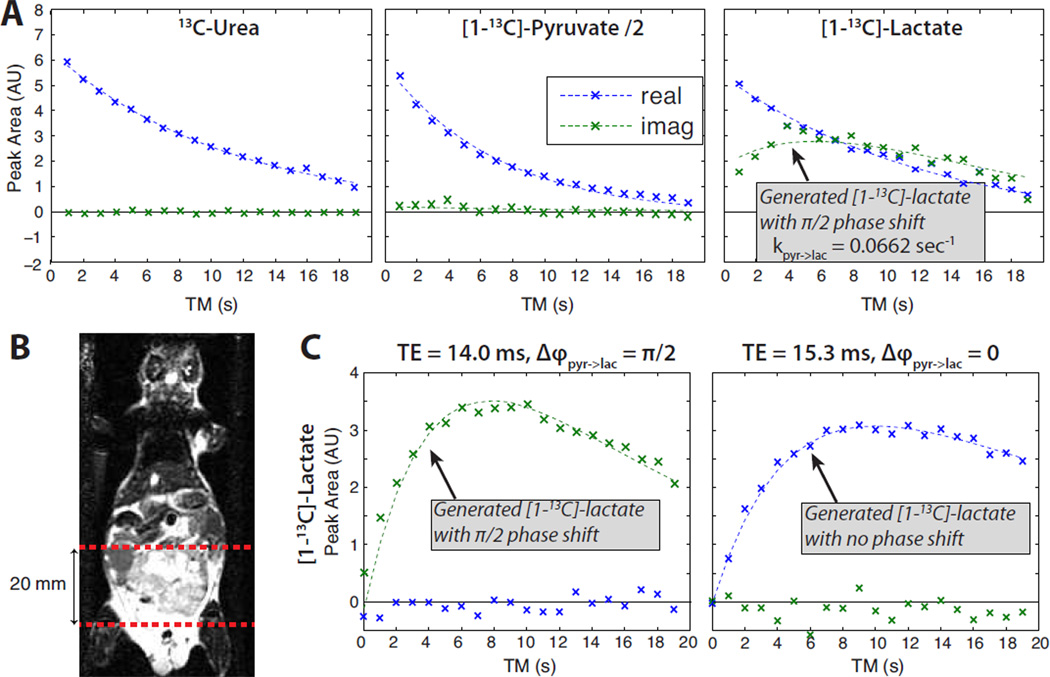
In this work, we present a new MR spectroscopy approach for directly observing nuclear spins that undergo exchange, metabolic conversion, or, generally, any frequency shift during a mixing time. Unlike conventional approaches to observe these processes, such as exchange spectroscopy (EXSY), this rapid approach requires only a single encoding step and thus is readily applicable to hyperpolarized MR in which the magnetization is not replenished after T(1) decay and RF excitations. This method is based on stimulated-echoes and uses phase-sensitive detection in conjunction with precisely chosen echo times in order to separate spins generated during the mixing time from those present prior to mixing. We are calling the method Metabolic Activity Decomposition Stimulated-echo Acquisition Mode or MAD-STEAM. We have validated this approach as well as applied it in vivo to normal mice and a transgenic prostate cancer mouse model for observing pyruvate-lactate conversion, which has been shown to be elevated in numerous tumor types. In this application, it provides an improved measure of cellular metabolism by separating [1-(13)C]-lactate produced in tissue by metabolic conversion from [1-(13)C]-lactate that has flowed into the tissue or is in the blood. Generally, MAD-STEAM can be applied to any system in which spins undergo a frequency shift.
Copyright © 2012 Elsevier Inc. All rights reserved.
Figures
Similar articles
-
Quantitative measurement of cancer metabolism using stimulated echo hyperpolarized carbon-13 MRS.Magn Reson Med. 2014 Jan;71(1):1-11. doi: 10.1002/mrm.24634. Epub 2013 Feb 14. Magn Reson Med. 2014. PMID: 23412881 Free PMC article.
-
Optimal variable flip angle schemes for dynamic acquisition of exchanging hyperpolarized substrates.J Magn Reson. 2013 Sep;234:75-81. doi: 10.1016/j.jmr.2013.06.003. Epub 2013 Jun 14. J Magn Reson. 2013. PMID: 23845910 Free PMC article.
-
Investigation of tumor hyperpolarized [1-13C]-pyruvate dynamics using time-resolved multiband RF excitation echo-planar MRSI.Magn Reson Med. 2010 Mar;63(3):582-91. doi: 10.1002/mrm.22264. Magn Reson Med. 2010. PMID: 20187172 Free PMC article.
-
Dynamic 2D and 3D mapping of hyperpolarized pyruvate to lactate conversion in vivo with efficient multi-echo balanced steady-state free precession at 3 T.NMR Biomed. 2020 Jun;33(6):e4291. doi: 10.1002/nbm.4291. Epub 2020 Mar 10. NMR Biomed. 2020. PMID: 32154970
-
[Quantitative cellular metabolism can be estimated by hyperpolarized magnetic resonance].Ugeskr Laeger. 2014 Aug 4;176(32):1486-9. Ugeskr Laeger. 2014. PMID: 25292470 Review. Danish.
Cited by
-
Hyperpolarized magnetic resonance as a sensitive detector of metabolic function.Biochemistry. 2014 Dec 2;53(47):7333-57. doi: 10.1021/bi501225t. Epub 2014 Nov 18. Biochemistry. 2014. PMID: 25369537 Free PMC article. Review.
-
A metabolite-specific 3D stack-of-spiral bSSFP sequence for improved lactate imaging in hyperpolarized [1-13 C]pyruvate studies on a 3T clinical scanner.Magn Reson Med. 2020 Sep;84(3):1113-1125. doi: 10.1002/mrm.28204. Epub 2020 Feb 21. Magn Reson Med. 2020. PMID: 32086845 Free PMC article.
-
13C Pyruvate Transport Across the Blood-Brain Barrier in Preclinical Hyperpolarised MRI.Sci Rep. 2018 Oct 10;8(1):15082. doi: 10.1038/s41598-018-33363-5. Sci Rep. 2018. PMID: 30305655 Free PMC article.
-
Dynamic metabolic imaging of hyperpolarized [2-(13) C]pyruvate using spiral chemical shift imaging with alternating spectral band excitation.Magn Reson Med. 2014 Jun;71(6):2051-8. doi: 10.1002/mrm.24871. Epub 2013 Jul 22. Magn Reson Med. 2014. PMID: 23878057 Free PMC article.
-
High spatiotemporal resolution bSSFP imaging of hyperpolarized [1-13 C]pyruvate and [1-13 C]lactate with spectral suppression of alanine and pyruvate-hydrate.Magn Reson Med. 2018 Sep;80(3):1048-1060. doi: 10.1002/mrm.27104. Epub 2018 Feb 16. Magn Reson Med. 2018. PMID: 29451329 Free PMC article.
References
-
- Kurhanewicz J, Vigneron DB, Brindle K, Chekmenev EY, Comment A, Cunningham CH, DeBerardinis RJ, Green GG, Leach MO, Rajan SS, Rizi RR, Ross BD, Warren WS, Malloy CR. Analysis of cancer metabolism by imaging hyperpolarized nuclei: Prospects for translation to clinical research. Neoplasia. 2011;13:81–97. - PMC - PubMed
-
- Chen AP, Albers MJ, Cunningham CH, Kohler SJ, Yen YF, Hurd RE, Tropp J, Bok R, Pauly JM, Nelson SJ, Kurhanewicz J, Vigneron DB. Hyperpolarized C-13 spectroscopic imaging of the TRAMP mouse at 3T–initial experience. Magn Reson Med. 2007;58:1099–1106. - PubMed
