Review
. 2012 Dec;53(12):1916-25.
doi: 10.2967/jnumed.112.105346. Epub 2012 Nov 9.

PET/MRI for neurologic applications

Affiliations
Review

PET/MRI for neurologic applications

Ciprian Catana et al. J Nucl Med. 2012 Dec.

Abstract

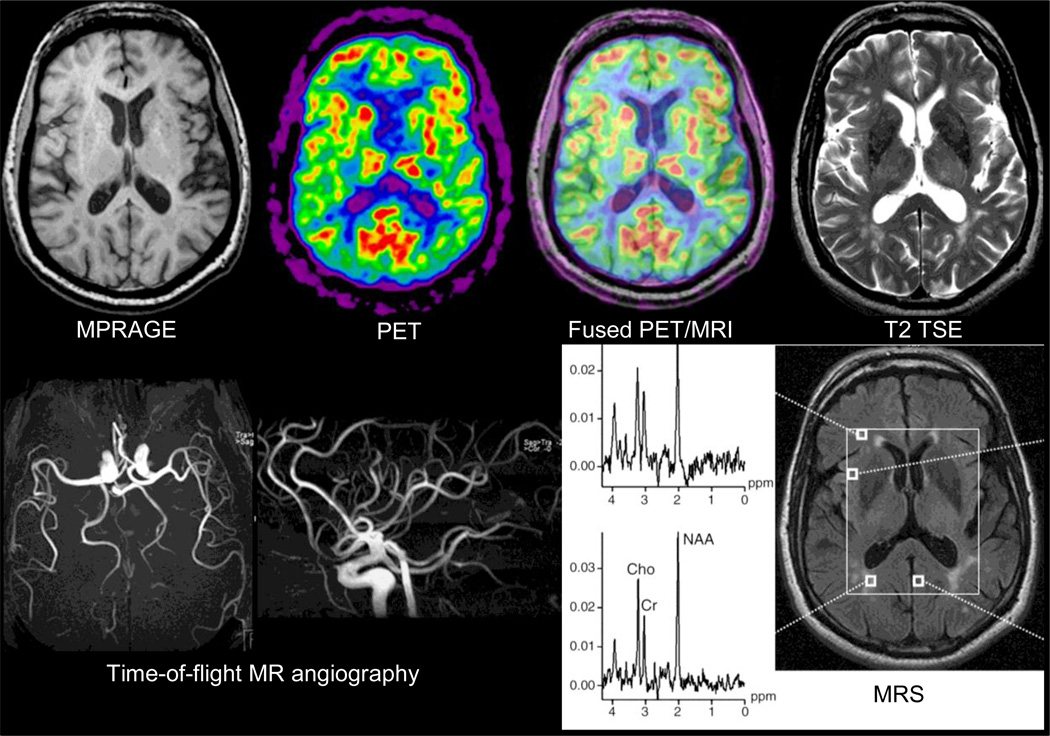
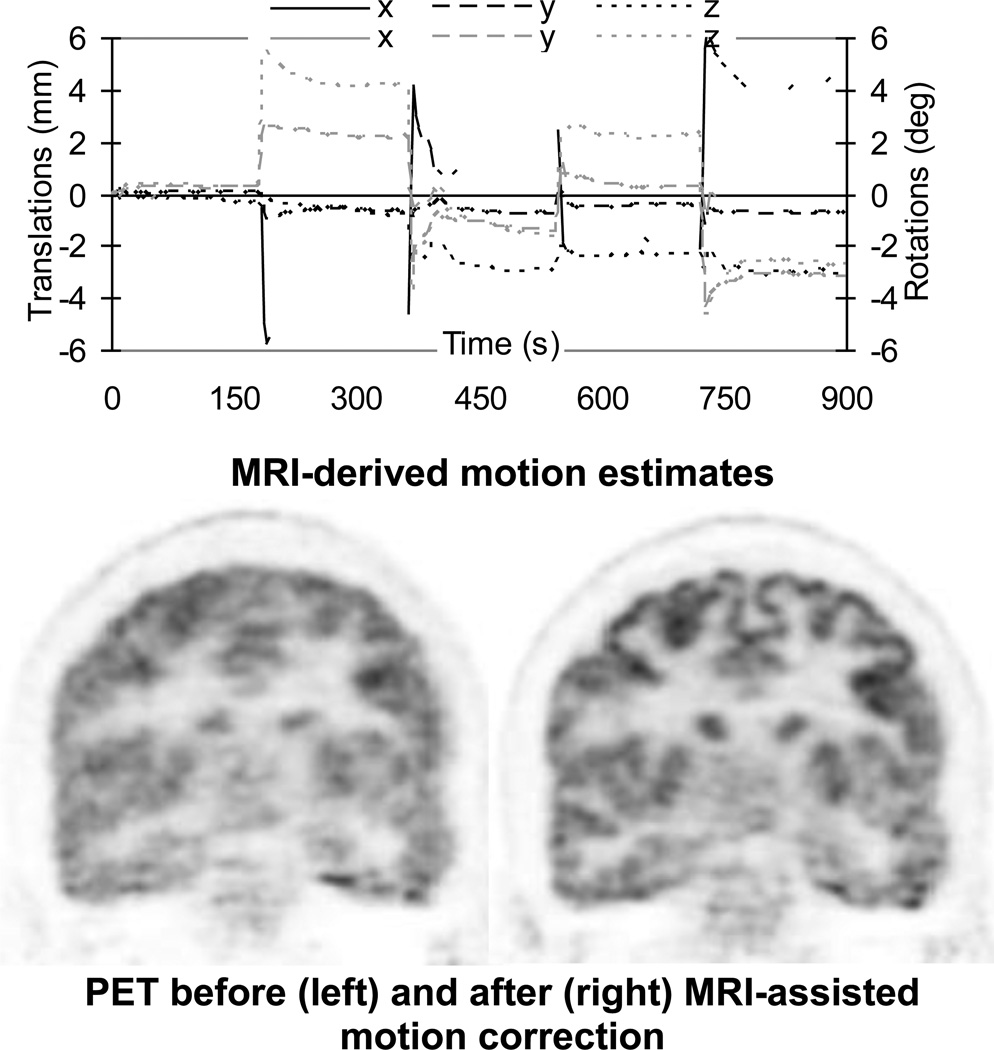
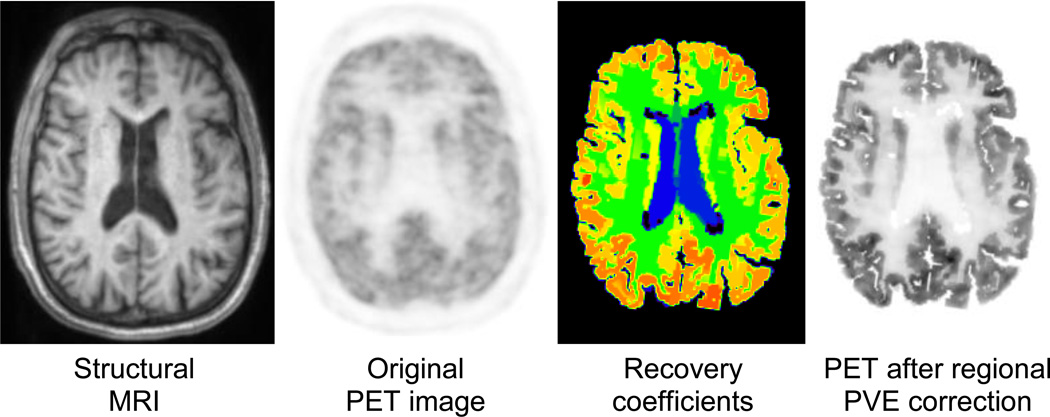
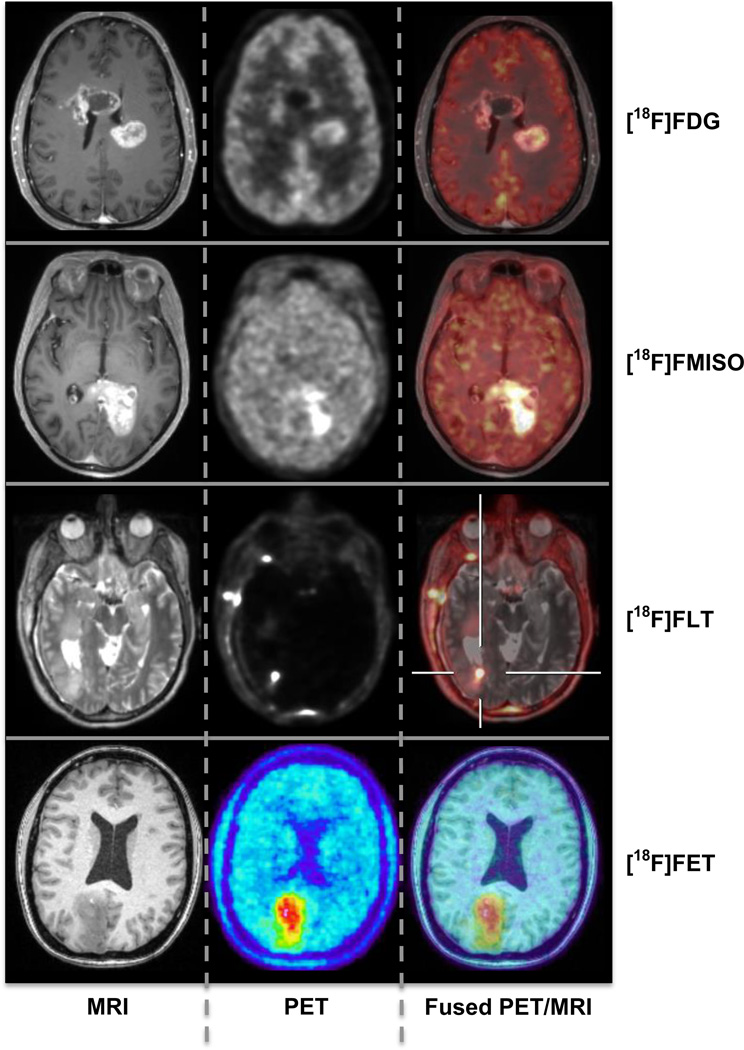
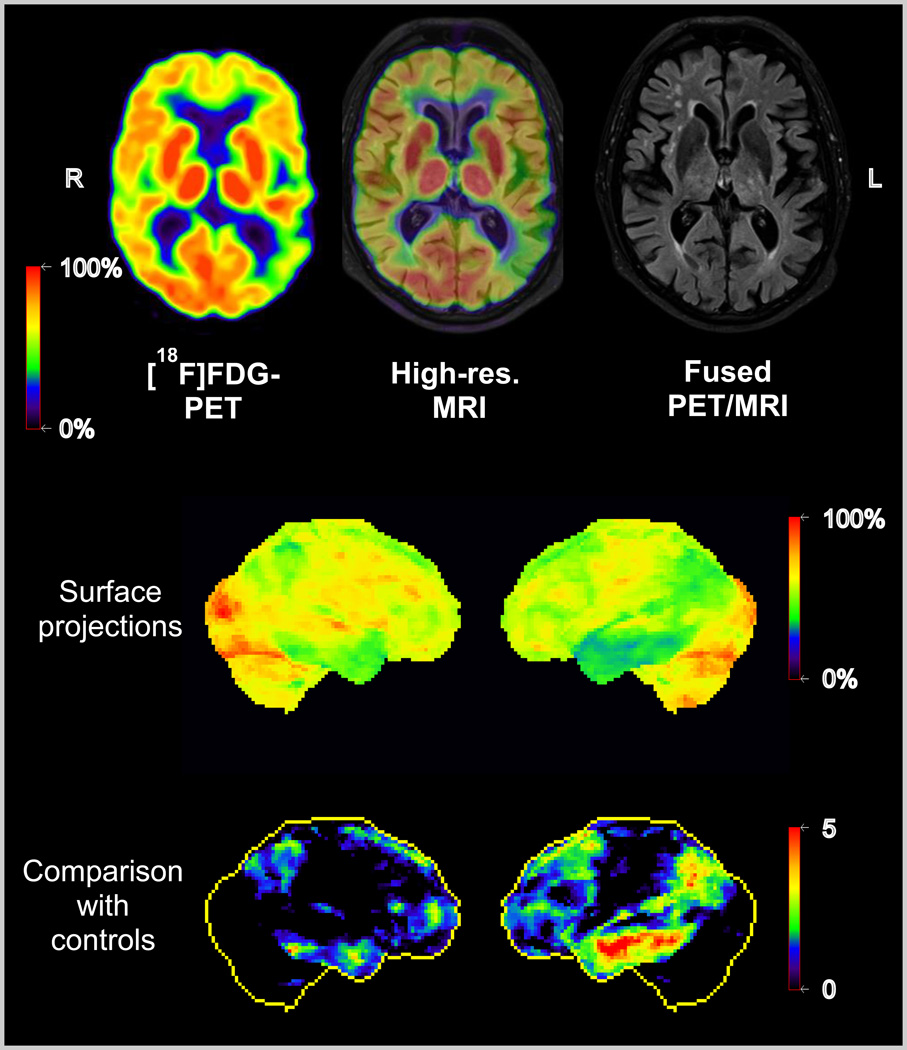
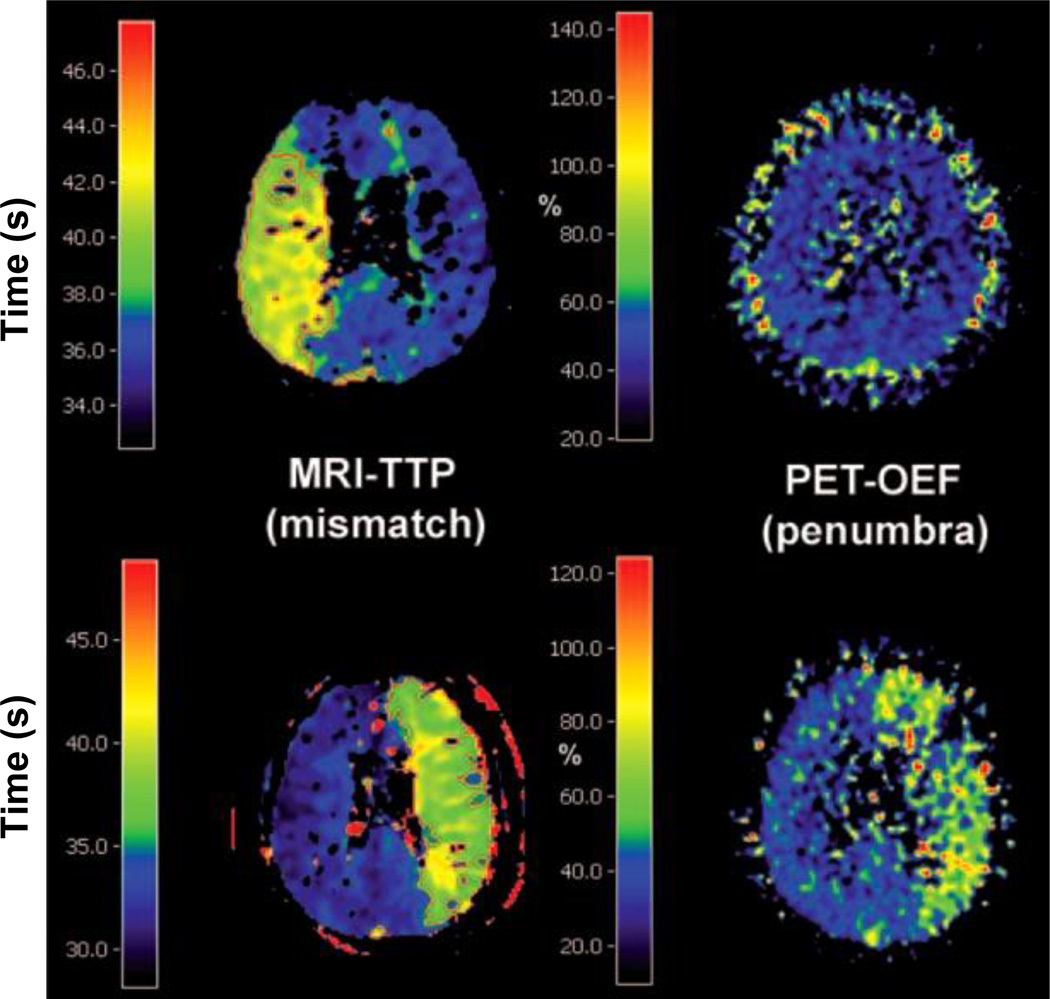
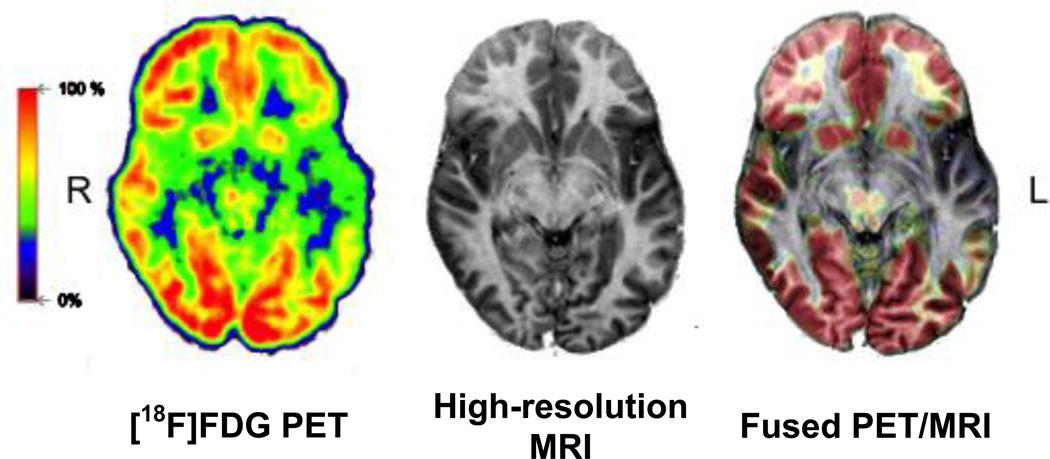
PET and MRI provide complementary information in the study of the human brain. Simultaneous PET/MRI data acquisition allows the spatial and temporal correlation of the measured signals, creating opportunities impossible to realize using stand-alone instruments. This paper reviews the methodologic improvements and potential neurologic and psychiatric applications of this novel technology. We first present methods for improving the performance and information content of each modality by using the information provided by the other technique. On the PET side, we discuss methods that use the simultaneously acquired MRI data to improve the PET data quantification. On the MRI side, we present how improved PET quantification can be used to validate several MRI techniques. Finally, we describe promising research, translational, and clinical applications that can benefit from these advanced tools.


Figures

Figure 1
Figure 1
First simultaneous PET/MR study in a 66-year-old healthy volunteer. The MR sequences run included T2 turbo spin echo, EPI, time-of-flight MR-angiography and MRS. The PET image displayed was reconstructed from the twenty-minute emission data recorded at steady state after injection of 370 MBq of FDG. Data acquired on the BrainPET prototype, Siemens, Knoxville, TN. Reproduced with permission from (1).
Figure 2
Figure 2
MRI-assisted PET motion correction in a healthy volunteer using EPI-derived motion estimates. Upper row: plots of motion estimates – translations along (black) and rotations about (gray) the three orthogonal axes. Lower row: PET data reconstructed before (left) and after (right) motion correction. Substantial improvement in image quality can be observed after correction. Data acquired on the BrainPET prototype, Martinos Center, MGH.
Figure 3
Figure 3
Influence of MR-based PVE correction on PET image contrast for a “normal” brain. From left to right, the MR image used to automatically segment ROIs of multiple brain structures, the original PET image, PVE correction factors for mean ROI values calculated via the geometric transfer matrix method using the segmented MR and original PET images as inputs, and the original PET image after application of the recovery coefficients. Data acquired on the BrainPET prototype, Martinos Center, MGH. Images courtesy of Spencer Bowen, PhD.
Figure 4
Figure 4
Simultaneous PET/MR studies in patients with brain tumors. From left to right: axial MR, PET and fused images are shown for different tracers: FDG, FMISO, FLT (data acquired on the BrainPET prototype, Martinos Center, MGH) and FET (data acquired on the BrainPET prototype, Forschungszentrum Juelich, Germany; images courtesy of Hans Herzog, PhD and Karl-Josef Langen, MD).
Figure 5
Figure 5
Simultaneous PET/MR study in an AD patient. Upper row: axial FDG-PET, high resolution MRI and fusion image. Areas with reduced metabolism (green) representing impaired neuronal function are visible in the left temporo-parietal cortex. Lower rows: Surface projections of cerebral metabolism and of Z-scores images (comparison with controls). Data acquired on the Biograph mMR scanner, Munich.
Figure 6
Figure 6
Comparison of MRI time-to-peak (TTP) and PET OEF images in two patients measured in the chronic phase of stroke illustrating the mismatch-penumbra debate. Disagreement between the two techniques is observed in the first (upper row) and agreement in the second case (lower row). Figure reproduced from (80).
Figure 7
Figure 7
Simultaneous PET/MR study in an epilepsy patient. From left to right: Axial FDG-PET (60–75 min post-injection), high resolution MRI-scan and fusion image. Distinct hypometabolism is visible in the polar region of the left temporal lobe, typically corresponding to the epileptogenic focus. Data acquired on the Biograph mMR scanner, Munich.

References

    1. Schlemmer H-PW, Pichler BJ, Schmand M, et al. Simultaneous MR/PET imaging of the human brain: feasibility study. Radiology. 2008;248:1028–1035. - PubMed
    1. Drzezga A, Souvatzoglou M, Eiber M, et al. First clinical experience with integrated whole-body PET/MR: comparison to PET/CT in patients with oncologic diagnoses. J Nucl Med. 2012 - PubMed
    1. Picard Y, Thompson CJ. Motion correction of PET images using multiple acquisition frames. IEEE Trans Med Imaging. 1997;16:137–144. - PubMed
    1. Fulton RR, Meikle SR, Eberl S, Pfeiffer J, Constable CJ, Fulham MJ. Correction for head movements in positron emission tomography using an optical motion-tracking system. IEEE Trans Nucl Sci. 2002;49:116–123.
    1. Bloomfield PM, Spinks TJ, Reed J, et al. The design and implementation of a motion correction scheme for neurological PET. Phys Med Biol. 2003;48:959–978. - PubMed

MeSH terms