

Single-molecule kinetics reveal microscopic mechanism by which High-Mobility Group B proteins alter DNA flexibility
- PMID: 23143110
- PMCID: PMC3592474
- DOI: 10.1093/nar/gks1031
Single-molecule kinetics reveal microscopic mechanism by which High-Mobility Group B proteins alter DNA flexibility
Abstract
Eukaryotic High-Mobility Group B (HMGB) proteins alter DNA elasticity while facilitating transcription, replication and DNA repair. We developed a new single-molecule method to probe non-specific DNA interactions for two HMGB homologs: the human HMGB2 box A domain and yeast Nhp6Ap, along with chimeric mutants replacing neutral N-terminal residues of the HMGB2 protein with cationic sequences from Nhp6Ap. Surprisingly, HMGB proteins constrain DNA winding, and this torsional constraint is released over short timescales. These measurements reveal the microscopic dissociation rates of HMGB from DNA. Separate microscopic and macroscopic (or local and non-local) unbinding rates have been previously proposed, but never independently observed. Microscopic dissociation rates for the chimeric mutants (~10 s(-1)) are higher than those observed for wild-type proteins (~0.1-1.0 s(-1)), reflecting their reduced ability to bend DNA through short-range interactions, despite their increased DNA-binding affinity. Therefore, transient local HMGB-DNA contacts dominate the DNA-bending mechanism used by these important architectural proteins to increase DNA flexibility.
Figures
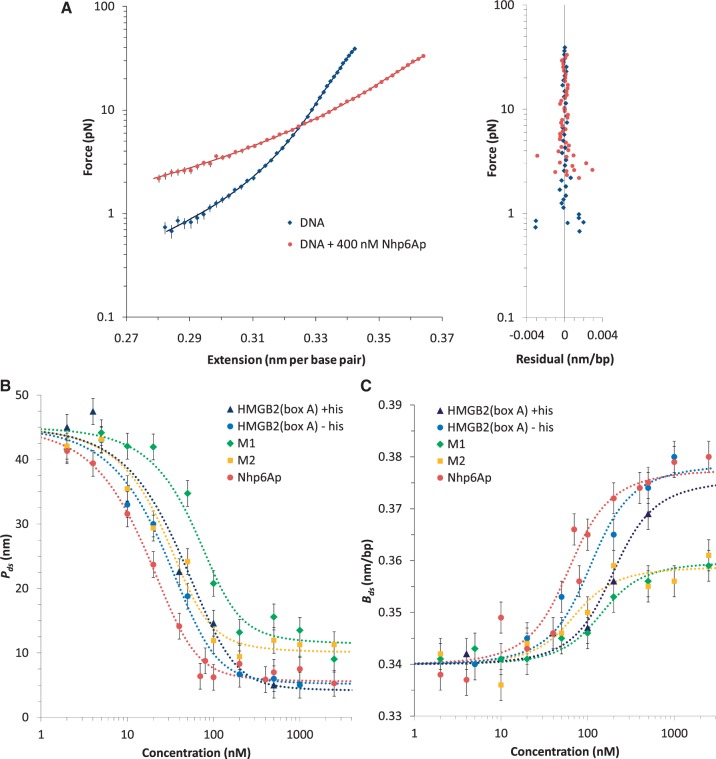
 = 0.45). When the DNA was exposed to 400 nM Nhp6Ap (red line), these fitted values became Pds = 6.7 ± 0.7 nm, Bds = 0.380 ± 0.002 nm/bp and Sds = 1240 ± 200 pN (
 = 0.37). Residuals to these fits are shown on the right. (B) Fitted HMGB–DNA persistence length, Pds(c), determined versus concentration of Nhp6Ap (red), constructs M1 (green) and M2 (yellow) and HMGB2 (box A) proteins with and without an N-terminal poly(His) tag (blue and cyan). Symbols represent averages of fitted parameters from three to six fitted data sets. Lines indicate fits to Equations 2 and 3, to determine the equilibrium constant, KD, and the persistence length of DNA saturated with protein, PL. (C) The HMGB–DNA contour length, Bds(c), fit to Equations 2 and 4, to determine the contour length of DNA saturated with protein, BL. The value of KD is indistinct from the fits of Figure 3B. All fits assume a fixed binding site size (n = 7) and weak cooperativity (ω = 20), while
  ranges from 0.5 to 2.0. Fitted parameters for all proteins are summarized in Table 1.
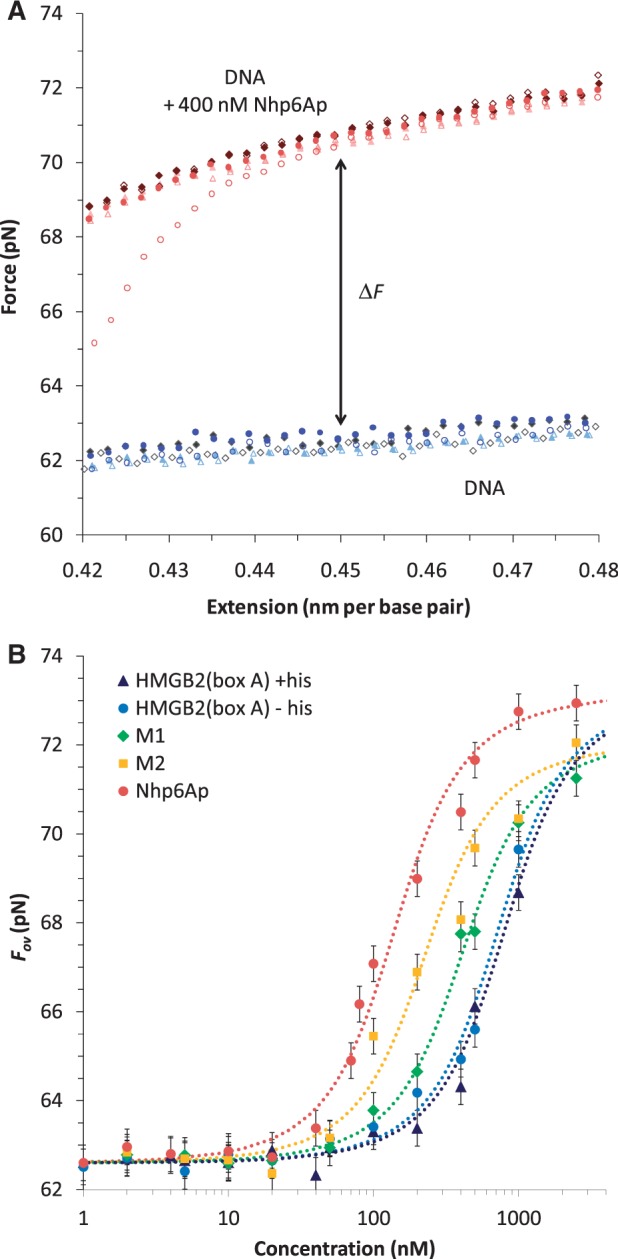
 . All fits assume a fixed binding site size (n = 7) and weak cooperativity (ω = 20), while
  ranges from 0.5 to 2.0. Fitted parameters are found in Table 2.
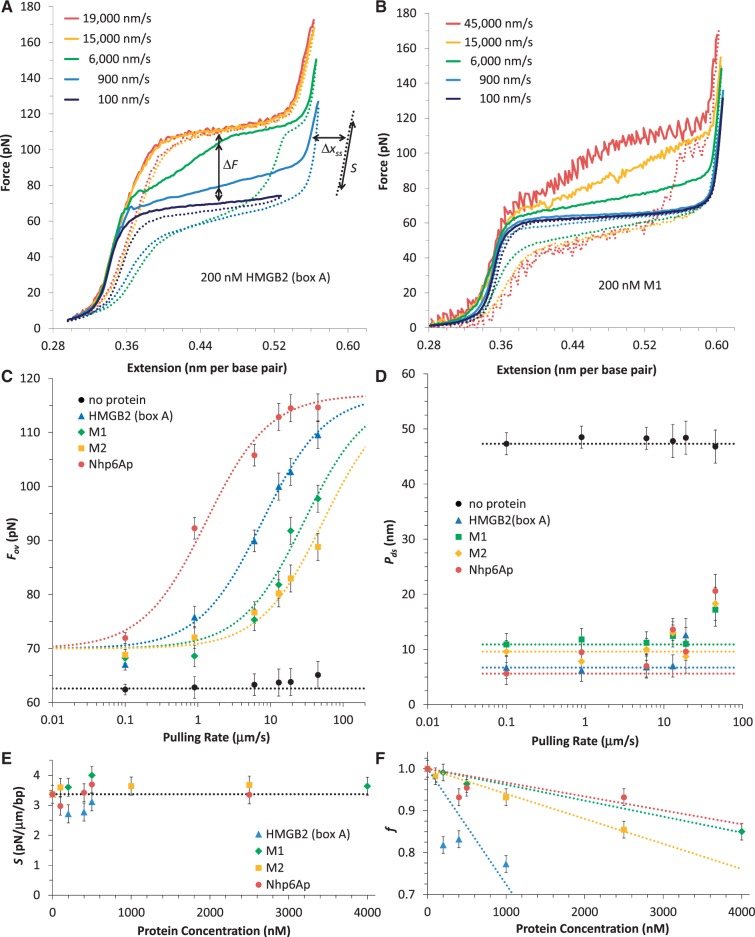
Similar articles
-
Enhancement of DNA flexibility in vitro and in vivo by HMGB box A proteins carrying box B residues.Biochemistry. 2009 Mar 17;48(10):2125-34. doi: 10.1021/bi802269f. Biochemistry. 2009. PMID: 19236006 Free PMC article.
-
Basic N-terminus of yeast Nhp6A regulates the mechanism of its DNA flexibility enhancement.J Mol Biol. 2012 Feb 10;416(1):10-20. doi: 10.1016/j.jmb.2011.12.004. Epub 2011 Dec 13. J Mol Biol. 2012. PMID: 22197373 Free PMC article.
-
Eukaryotic HMGB proteins as replacements for HU in E. coli repression loop formation.Nucleic Acids Res. 2008 Jul;36(12):4009-21. doi: 10.1093/nar/gkn353. Epub 2008 May 31. Nucleic Acids Res. 2008. PMID: 18515834 Free PMC article.
-
Single-molecule studies of high-mobility group B architectural DNA bending proteins.Biophys Rev. 2016 Nov 15;9(1):17-40. doi: 10.1007/s12551-016-0236-4. eCollection 2017 Feb. Biophys Rev. 2016. PMID: 28303166 Free PMC article. Review.
-
HMGB family proteins: Potential biomarkers and mechanistic factors in cardiovascular diseases.Biomed Pharmacother. 2023 Sep;165:115118. doi: 10.1016/j.biopha.2023.115118. Epub 2023 Jul 10. Biomed Pharmacother. 2023. PMID: 37437373 Review.
Cited by
-
Human FACT subunits coordinate to catalyze both disassembly and reassembly of nucleosomes.Cell Rep. 2022 Dec 27;41(13):111858. doi: 10.1016/j.celrep.2022.111858. Cell Rep. 2022. PMID: 36577379 Free PMC article.
-
Cisplatin fastens chromatin irreversibly even at a high chloride concentration.Nucleic Acids Res. 2021 Dec 2;49(21):12035-12047. doi: 10.1093/nar/gkab922. Nucleic Acids Res. 2021. PMID: 34865121 Free PMC article.
-
New Insights into the Role of HMGB2 in ST-Segment Elevation Myocardial Infarction.Int J Gen Med. 2023 Sep 14;16:4181-4191. doi: 10.2147/IJGM.S429761. eCollection 2023. Int J Gen Med. 2023. PMID: 37727529 Free PMC article.
-
Single molecule fluorescence methodologies for investigating transcription factor binding kinetics to nucleosomes and DNA.Methods. 2014 Dec;70(2-3):108-18. doi: 10.1016/j.ymeth.2014.09.011. Epub 2014 Oct 7. Methods. 2014. PMID: 25304387 Free PMC article.
-
Unexpected sequences and structures of mtDNA required for efficient transcription from the first heavy-strand promoter.Elife. 2017 Jul 26;6:e27283. doi: 10.7554/eLife.27283. Elife. 2017. PMID: 28745586 Free PMC article.
References
Publication types
MeSH terms
Substances
Grants and funding
LinkOut - more resources
Full Text Sources
Molecular Biology Databases
Miscellaneous
