. 2013 Jan;125(1):95-109.
doi: 10.1007/s00401-012-1058-5. Epub 2012 Nov 13.

Unravelling the enigma of selective vulnerability in neurodegeneration: motor neurons resistant to degeneration in ALS show distinct gene expression characteristics and decreased susceptibility to excitotoxicity

Affiliations

Unravelling the enigma of selective vulnerability in neurodegeneration: motor neurons resistant to degeneration in ALS show distinct gene expression characteristics and decreased susceptibility to excitotoxicity

Alice Brockington et al. Acta Neuropathol. 2013 Jan.

Abstract

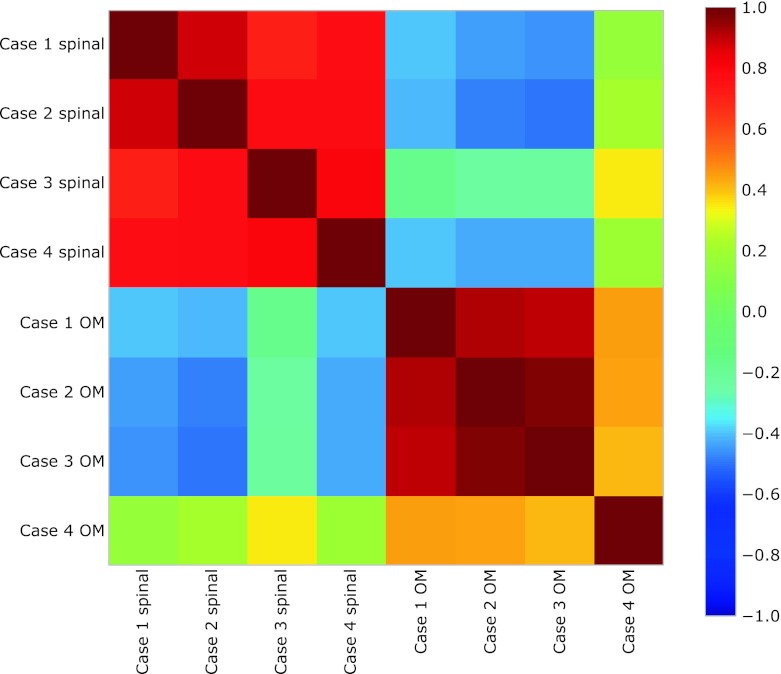
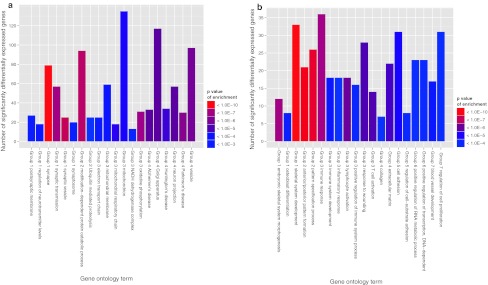
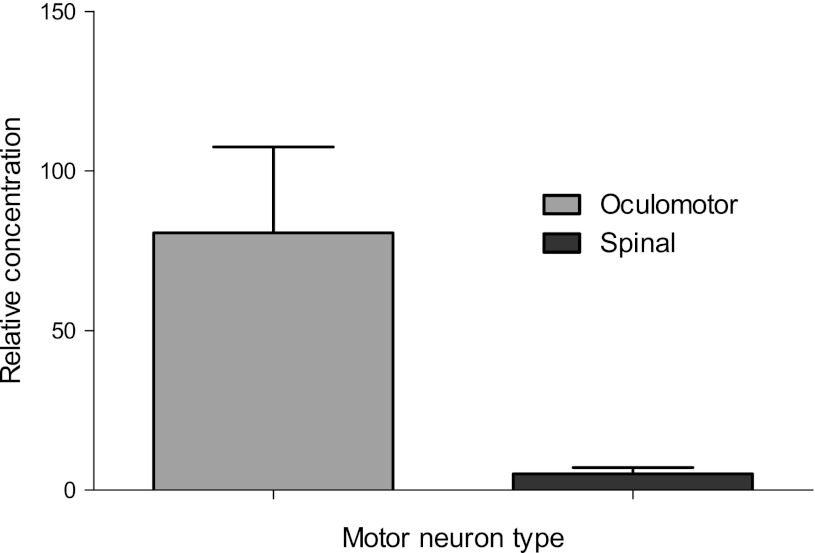
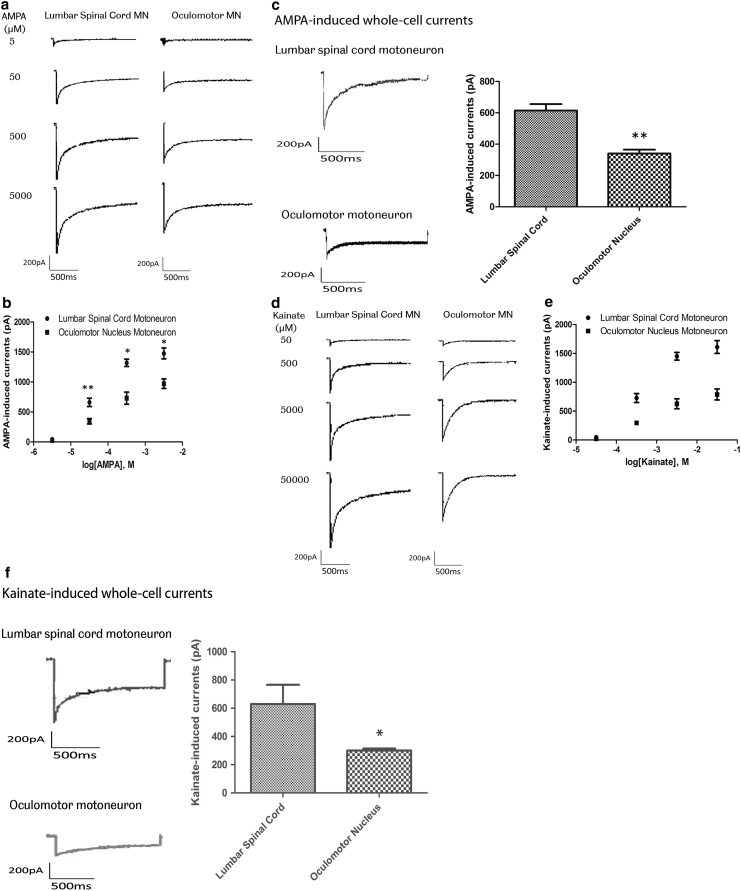
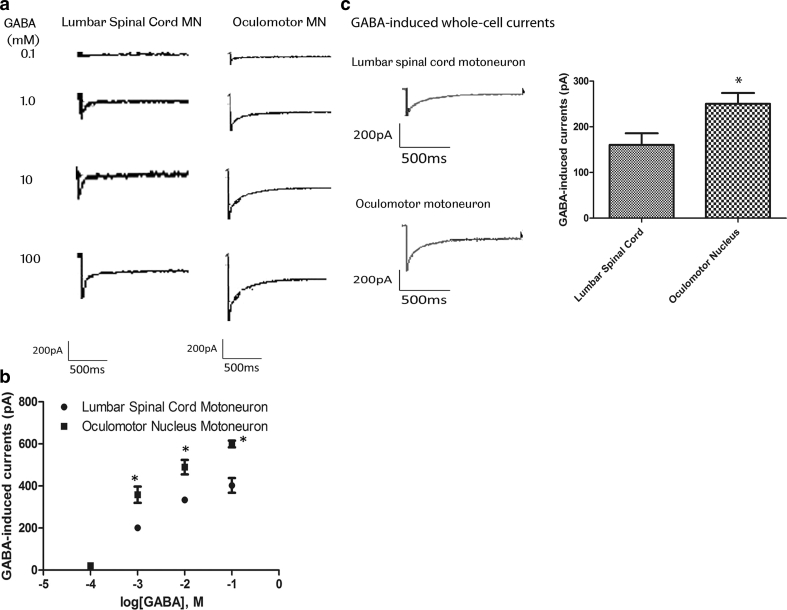
A consistent clinical feature of amyotrophic lateral sclerosis (ALS) is the sparing of eye movements and the function of external sphincters, with corresponding preservation of motor neurons in the brainstem oculomotor nuclei, and of Onuf's nucleus in the sacral spinal cord. Studying the differences in properties of neurons that are vulnerable and resistant to the disease process in ALS may provide insights into the mechanisms of neuronal degeneration, and identify targets for therapeutic manipulation. We used microarray analysis to determine the differences in gene expression between oculomotor and spinal motor neurons, isolated by laser capture microdissection from the midbrain and spinal cord of neurologically normal human controls. We compared these to transcriptional profiles of oculomotor nuclei and spinal cord from rat and mouse, obtained from the GEO omnibus database. We show that oculomotor neurons have a distinct transcriptional profile, with significant differential expression of 1,757 named genes (q < 0.001). Differentially expressed genes are enriched for the functional categories of synaptic transmission, ubiquitin-dependent proteolysis, mitochondrial function, transcriptional regulation, immune system functions, and the extracellular matrix. Marked differences are seen, across the three species, in genes with a function in synaptic transmission, including several glutamate and GABA receptor subunits. Using patch clamp recording in acute spinal and brainstem slices, we show that resistant oculomotor neurons show a reduced AMPA-mediated inward calcium current, and a higher GABA-mediated chloride current, than vulnerable spinal motor neurons. The findings suggest that reduced susceptibility to excitotoxicity, mediated in part through enhanced GABAergic transmission, is an important determinant of the relative resistance of oculomotor neurons to degeneration in ALS.


Figures

Fig. 1
Fig. 1
Covariance matrix for the gene expression dataset, evaluated using only the top 100 differentially expressed genes. The samples on both axes are ordered according to the tissue type. The two visible blocks correspond to the two groups, indicating that the most differentially expressed genes are able to capture the difference between oculomotor and spinal cord samples. Each square in the plot shows the correlation between each pair of samples. Warm colours correspond to a high positive correlation, while cold colours correspond to a high negative correlation
Fig. 2
Fig. 2
Numbers of significantly differentially expressed genes assigned to enriched gene ontology terms. The 20 most enriched KEGG pathways and GO terms in the categories of biological process and cell component are shown. Redundant terms were removed for clarity. a Genes upregulated in oculomotor neurons (q value for enrichment <0.05). Group 1 synaptic function, Group 2 ubiquitin-mediated proteolysis, Group 3 oxidative phosphorylation and mitochondrial function, Group 4 other. b Genes upregulated in spinal motor neurons (q value for enrichment <0.005). Group 1 skeletal development, Group 2 embryonic pattern formation, Group 3 immune system processes, Group 4 the extracellular matrix, Group 5 cell adhesion, Group 6 regulation of transcription, Group 7 other
Fig. 3
Fig. 3
Concentration of GABRA1 relative to β-actin in laser-captured motor oculomotor and spinal motor neurons determined by QPCR (2 cases, n = 6 replicates). Error bars represent SEM
Fig. 4
Fig. 4
a and b Concentration–response relation for AMPA-induced whole-cell currents in lumbar spinal cord and oculomotor neurons. Currents were recorded in 20 mM extracellular Na+ at −60 mV, in response to AMPA concentrations ranging from 5 μM to 5 mM. a Representative current traces elicited by AMPA. b Each point represents mean ± SEM from three cells (*P < 0.05, **P < 0.01, Student’s t test). EC50 values estimated from fits to pooled data were 118.6 μM for lumbar spinal cord motor neurons and 123.2 μM for oculomotor neurons. c Whole-cell currents recorded in Na+-free extracellular solution containing 50 mM Ca2+ at −60 mV in lumbar spinal cord and oculomotor neurons, evoked by AMPA 100 μM (n = 6). Columns represent the peak amplitudes of agonist-induced whole-cell currents (mean ± SEM, **P < 0.001, P < 0.05, Student’s t test). d and e Concentration–response relation for kainate-induced whole-cell currents in lumbar spinal cord and oculomotor neurons. Currents were recorded in 20 mM extracellular Na+ at −60 mV, in response to kainate concentrations ranging from 50 μM to 50 mM. d Representative current traces elicited by kainate. e Each point represents mean ± SEM from three cells (*P < 0.05, **P < 0.01, Student’s t test). EC50 values estimated from fits to pooled data were 1.12 mM for lumbar spinal cord motor neurons and 1.26 mM for oculomotor motor neurons, respectively. f Whole-cell currents recorded in Na+-free extracellular solution containing 50 mM Ca2+ at −60 mV in lumbar spinal cord and oculomotor neurons, evoked by kainate 1 mM (n = 6). Columns represent the peak amplitudes of agonist-induced whole-cell currents (mean ± SEM, **P < 0.001, P < 0.05, Student’s t test)
Fig. 5
Fig. 5
a and b Concentration–response relation for GABA-induced whole-cell currents in lumbar spinal cord and oculomotor motor neurons. Currents were recorded at −60 mV, in response to GABA concentrations ranging from 0.1 mM to 100 mM. Each point represents mean ± SEM from three cells (*P < 0.05, Student’s t test). EC50 values estimated from fits to pooled data were 6.1 mM for lumbar spinal cord motor neurons and 5.7 mM for oculomotor motor neurons, respectively. c GABA-induced whole-cell currents in lumbar spinal cord and oculomotor neurons. Whole-cell currents evoked by 6 mM GABA were recorded at −60 mV. Columns represent the peak amplitudes of GABA-induced whole-cell currents (mean ± SEM, *P < 0.05, n = 6, Student’s t test)

References

    1. Ashburner M, Ball CA, Blake JA, Botstein D, Butler H, Cherry JM, Davis AP, Dolinski K, Dwight SS, Eppig JT, Harris MA, Hill DP, Issel-Tarver L, Kasarskis A, Lewis S, Matese JC, Richardson JE, Ringwald M, Rubin GM, Sherlock G. Gene ontology: tool for the unification of biology. The Gene Ontology Consortium. Nat Genet. 2000;25(1):25–29. doi: 10.1038/75556. - DOI - PMC - PubMed
    1. Chang Q, Martin LJ. Glycine receptor channels in spinal motoneurons are abnormal in a transgenic mouse model of amyotrophic lateral sclerosis. J Neurosci. 2011;31(8):2815–2827. doi: 10.1523/JNEUROSCI.2475-10.2011. - DOI - PMC - PubMed
    1. Dalla Torre di Sanguinetto SA, Dasen JS, Arber S. Transcriptional mechanisms controlling motor neuron diversity and connectivity. Curr Opin Neurobiol. 2008;18(1):36–43. doi: 10.1016/j.conb.2008.04.002. - DOI - PubMed
    1. Dasen JS, Tice BC, Brenner-Morton S, Jessell TM. A Hox regulatory network establishes motor neuron pool identity and target-muscle connectivity. Cell. 2005;123(3):477–491. doi: 10.1016/j.cell.2005.09.009. - DOI - PubMed
    1. Davidson D, Graham E, Sime C, Hill R. A gene with sequence similarity to Drosophila engrailed is expressed during the development of the neural tube and vertebrae in the mouse. Development. 1988;104(2):305–316. - PubMed

Publication types

MeSH terms